A random sample ef n, - 292 veters registered in the state of Cafernia showed that 144 voted in the last general election. A randem sample of ny- 228 registered voters in the state of Colorado showed that 130 voted in the most recent general election. De these data indicate that the population proportion of voter burneut in Colorado is higher than that in Califernia Use a S level of significance. (a) What is the level of significance State the nu and alternate hypotheses O Mi P Pi PP O Mi PPi M P () what sampling distritution wil you use what assumptions are you making O The Student's e. We assume the population distributions are approximately normal. O The standard normal. We assume the population distributions are approximately normal. O The standard normal. The number of trials is sumciently large. O The Student's e. The number of trials is sufficiently large What is the value of the sample test statistic? (Test the dfference p,- P. Do not use rounded values. Round your final answer to two decimal places.) O (e) Find (or estimate) the Pvalue. (Round your answer to four decimal places.) Sketch the samping distritution and shew the area cerresponding to the Avalue. (4) Based on your answers in parts (a) te (e), will you reject or fail to reject the null hypothesis? Are the data statistically significant at level a O At the o.05 level, we reject the null hypethesis and conclude the data are statistically significant OAt the e0.05 level, we fall to reject the null hypothesis and conclude the data are statistically signiicant. O At the a0.0S level, we fal to reject the nul hypothesis and conclude the data are not statistically signiticant. O AL the a0.0s level, we reject the nul hypethesis and conclude the data are not statistically significant. (e) Interpret your conclusion in the context of the application O Pail to reject the nul hypothesis, there is insuficient evidence that the proportien of voter turneut in Colorade is greater than that in California. O Reject the nul hypothesis, there is insumcient evidence that the proportion of veter turnout in Colorado is greater than that in California. O Fal to reject the nul hypethesis, there is sufficient evidence that the proportion of voter turneut in Colorade is greater than that in California O Reject the null hypothesis, there is sumcient evidence that the proportion of veter turnout in Colorado is greater than that in California.
A random sample ef n, - 292 veters registered in the state of Cafernia showed that 144 voted in the last general election. A randem sample of ny- 228 registered voters in the state of Colorado showed that 130 voted in the most recent general election. De these data indicate that the population proportion of voter burneut in Colorado is higher than that in Califernia Use a S level of significance. (a) What is the level of significance State the nu and alternate hypotheses O Mi P Pi PP O Mi PPi M P () what sampling distritution wil you use what assumptions are you making O The Student's e. We assume the population distributions are approximately normal. O The standard normal. We assume the population distributions are approximately normal. O The standard normal. The number of trials is sumciently large. O The Student's e. The number of trials is sufficiently large What is the value of the sample test statistic? (Test the dfference p,- P. Do not use rounded values. Round your final answer to two decimal places.) O (e) Find (or estimate) the Pvalue. (Round your answer to four decimal places.) Sketch the samping distritution and shew the area cerresponding to the Avalue. (4) Based on your answers in parts (a) te (e), will you reject or fail to reject the null hypothesis? Are the data statistically significant at level a O At the o.05 level, we reject the null hypethesis and conclude the data are statistically significant OAt the e0.05 level, we fall to reject the null hypothesis and conclude the data are statistically signiicant. O At the a0.0S level, we fal to reject the nul hypothesis and conclude the data are not statistically signiticant. O AL the a0.0s level, we reject the nul hypethesis and conclude the data are not statistically significant. (e) Interpret your conclusion in the context of the application O Pail to reject the nul hypothesis, there is insuficient evidence that the proportien of voter turneut in Colorade is greater than that in California. O Reject the nul hypothesis, there is insumcient evidence that the proportion of veter turnout in Colorado is greater than that in California. O Fal to reject the nul hypethesis, there is sufficient evidence that the proportion of voter turneut in Colorade is greater than that in California O Reject the null hypothesis, there is sumcient evidence that the proportion of veter turnout in Colorado is greater than that in California.

College Algebra (MindTap Course List)
12th Edition
ISBN:9781305652231
Author:R. David Gustafson, Jeff Hughes
Publisher:R. David Gustafson, Jeff Hughes
Chapter8: Sequences, Series, And Probability
Section8.7: Probability
Problem 58E: What is meant by the sample space of an experiment?

Related questions
Question
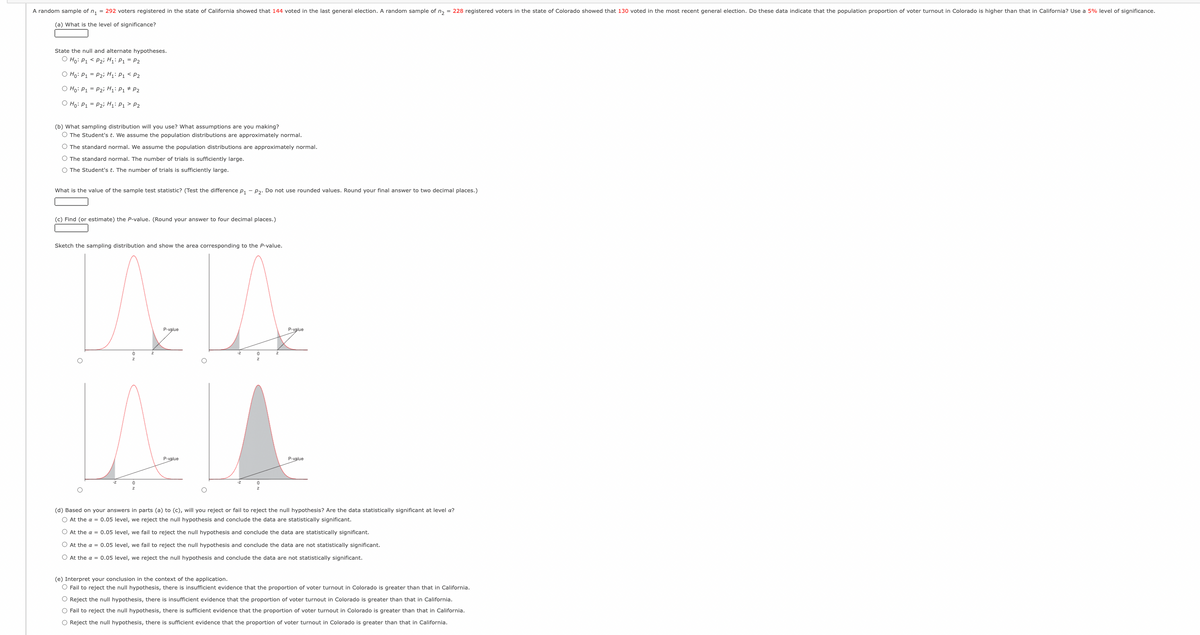
Transcribed Image Text:A random sample of n, = 292 voters registered in the state of California showed that 144 voted in the last general election. A random sample of n, = 228 registered voters in the state of Colorado showed that 130 voted in the most recent general election. Do these data indicate that the population proportion of voter turnout in Colorado is higher than that in California? Use a 5% level of significance.
(a) What is the level of significance?
State the null and alternate hypotheses.
O Ho: P1 < P2i Hi: P1 = P2
O Ho: P1 = P2i H;: P1 < P2
O Ho: P1 = P2i H: P1 * P2
O Ho: P1 = P2i H;: P1 > P2
(b) What sampling distribution will you use? What assumptions are you making?
O The Student's t. We assume the population distributions are approximately normal.
O The standard normal. We assume the population distributions are approximately normal.
O The standard normal. The number of trials is sufficiently large.
O The Student's t. The number of trials is sufficiently large.
What is the value of the sample test statistic? (Test the difference p, - p2. Do not use rounded values. Round your final answer to two decimal places.)
(c) Find (or estimate) the P-value. (Round your answer to four decimal places.)
Sketch the sampling distribution and show the area corresponding to the P-value.
P-value
P-value
P-value
P-value
(d) Based on your answers in parts (a) to (c), will you reject or fail to reject the null hypothesis? Are the data statistically significant at level a?
O At the a = 0.05 level, we reject the null hypothesis and conclude the data are statistically significant.
O At the a = 0.05 level, we fail to reject the null hypothesis and conclude the data are statistically significant.
O At the a = 0.05 level, we fail to reject the null hypothesis and conclude the data are not statistically significant.
O At the a = 0.05 level, we reject the null hypothesis and conclude the data are not statistically significant.
(e) Interpret your conclusion in the context of the application.
O Fail to reject the null hypothesis, there is insufficient evidence that the proportion of voter turnout in Colorado is greater than that in California.
O Reject the null hypothesis, there is insufficient evidence that the proportion of voter turnout in Colorado is greater than that in California.
O Fail to reject the null hypothesis, there is sufficient evidence that the proportion of voter turnout in Colorado is greater than that in California.
O Reject the null hypothesis, there is sufficient evidence that the proportion of voter turnout in Colorado is greater than that in California.
Expert Solution
This question has been solved!
Explore an expertly crafted, step-by-step solution for a thorough understanding of key concepts.

Step by step
Solved in 4 steps with 5 images

Recommended textbooks for you
College Algebra (MindTap Course List)
Algebra
ISBN:
9781305652231
Author:
R. David Gustafson, Jeff Hughes
Publisher:
Cengage Learning

College Algebra (MindTap Course List)
Algebra
ISBN:
9781305652231
Author:
R. David Gustafson, Jeff Hughes
Publisher:
Cengage Learning