A. Given the observed values below, is there an agreement between the expected and observed ratios? Does it fit the 3:1 ratio? State the reason behind. Phenotypes (Purple is dominant Observed values over yellow corn) Purple corn Yellow corn 175 52 1|Page B. Given the observed values below, is there an agreement between the expected and observed ratios? Does it fit the 3:1 ratio? State the reason behind. Phenotypes (Purple is dominantObserved values over yellow corn) Purple corn Yellow corn 176 52 C. Given the observed values below, is there an agreement between the expected and observed ratios? Does it fit the 3:1 ratio? State the reason behind. Phenotypes (Purple is dominant Observed values over yellow corn) Purple corn Yellow corn 227 32
A. Given the observed values below, is there an agreement between the expected and observed ratios? Does it fit the 3:1 ratio? State the reason behind. Phenotypes (Purple is dominant Observed values over yellow corn) Purple corn Yellow corn 175 52 1|Page B. Given the observed values below, is there an agreement between the expected and observed ratios? Does it fit the 3:1 ratio? State the reason behind. Phenotypes (Purple is dominantObserved values over yellow corn) Purple corn Yellow corn 176 52 C. Given the observed values below, is there an agreement between the expected and observed ratios? Does it fit the 3:1 ratio? State the reason behind. Phenotypes (Purple is dominant Observed values over yellow corn) Purple corn Yellow corn 227 32

Holt Mcdougal Larson Pre-algebra: Student Edition 2012
1st Edition
ISBN:9780547587776
Author:HOLT MCDOUGAL
Publisher:HOLT MCDOUGAL
Chapter11: Data Analysis And Probability
Section11.1: Stem-and-leaf Plots And Histograms
Problem 5E

Related questions
Question
Transcribed Image Text:CHI-SQUARE TEST
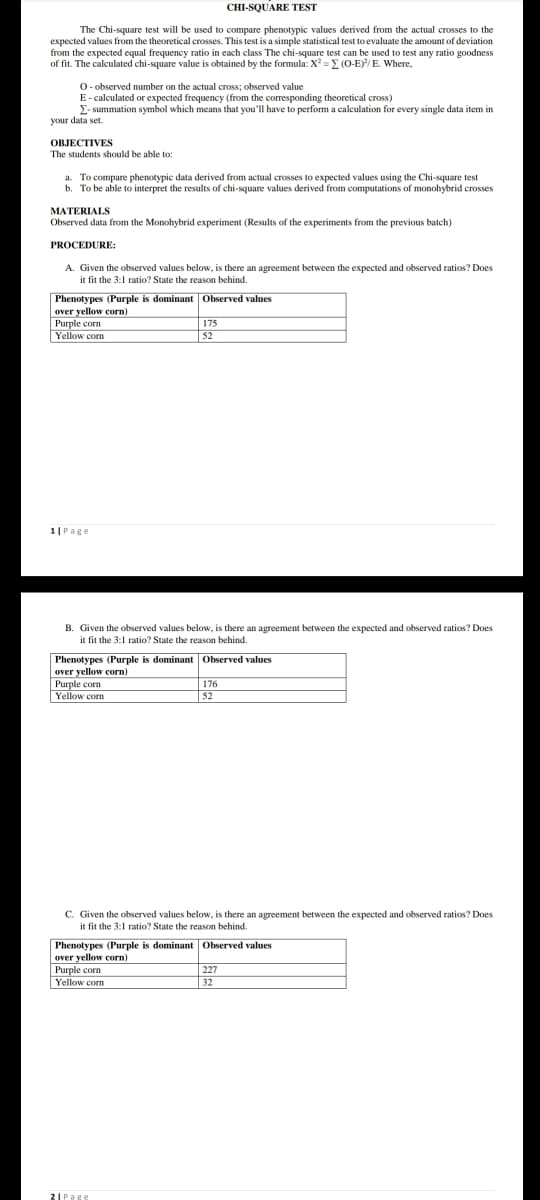
The Chi-square test will be used to compare phenotypic values derived from the actual crosses to the
expected values from the theoretical crosses. This test is a simple statistical test to evaluate the amount of deviation
from the expected equal frequency ratio in cach class The chi-square test can be used to test any ratio goodness
of fit. The calculated chi-square value is obtained by the formula: X =E (O-E)/E. Where,
O- observed number on the actual cross; observed value
E- calculated or expected frequency (from the corresponding theoretical cross)
E- summation symbol which means that you'll have to perform a calculation for every single data item in
your data set.
ОВJЕСTIVES
The students should be able to:
a. To compare phenotypic data derived from actual crosses to expected values using the Chi-square test
b. To be able to interpret the results of chi-square values derived from computations of monohybrid crosses
MATERIALS
Observed data from the Monohybrid experiment (Results of the experiments from the previous batch)
PROCEDURE:
A. Given the observed values below, is there an agreement between the expected and observed ratios? Does
it fit the 3:1 ratio? State the reason behind.
Phenotypes (Purple is dominant Observed values
over yellow corn)
Purple corn
175
52
Yellow corn
1|Page
B. Given the observed values below, is there an agreement between the expected and observed ratios? Does
it fit the 3:1 ratio? State the reason behind.
Phenotypes (Purple is dominant Observed values
over yellow corn)
Purple corn
Yellow corm
176
52
C. Given the observed values below, is there an agreement between the expected and observed ratios? Does
it fit the 3:1 ratio? State the reason behind.
Phenotypes (Purple is dominant Observed values
over yellow corn)
Purple corm
Yellow corn
227
32
Expert Solution
This question has been solved!
Explore an expertly crafted, step-by-step solution for a thorough understanding of key concepts.

Step by step
Solved in 4 steps

Recommended textbooks for you
Holt Mcdougal Larson Pre-algebra: Student Edition…
Algebra
ISBN:
9780547587776
Author:
HOLT MCDOUGAL
Publisher:
HOLT MCDOUGAL

Algebra and Trigonometry (MindTap Course List)
Algebra
ISBN:
9781305071742
Author:
James Stewart, Lothar Redlin, Saleem Watson
Publisher:
Cengage Learning

College Algebra
Algebra
ISBN:
9781305115545
Author:
James Stewart, Lothar Redlin, Saleem Watson
Publisher:
Cengage Learning
Holt Mcdougal Larson Pre-algebra: Student Edition…
Algebra
ISBN:
9780547587776
Author:
HOLT MCDOUGAL
Publisher:
HOLT MCDOUGAL
Algebra and Trigonometry (MindTap Course List)
Algebra
ISBN:
9781305071742
Author:
James Stewart, Lothar Redlin, Saleem Watson
Publisher:
Cengage Learning
College Algebra
Algebra
ISBN:
9781305115545
Author:
James Stewart, Lothar Redlin, Saleem Watson
Publisher:
Cengage Learning