a. How many elements are in this data set?   b. Of the following subset of variables, indicate which are categorical and which are quantitative: Exchange       ["quantative", "categorical"]  , Price/Earnings Ratio       ["quantitive", "categorical"]  , Gross Profit Margin.      ["quantitive", "categorical"]    c. Indicate the scale of  measurement for the variables: Exchange, Price/Earnings Ratio, Gross Profit Margin (%): Exchange is      ["ratio scale", "interval scale", "ordinal scale", "nomial scale"]  Price/Earnings Ratio  is      ["ratio scale", "interval scale", "ordinal scale", "nomial scale"]  Gross Profit Margin (%) is       ["ratio scale", "interval scale", "ordinal scale", "nomial scale"]  .

MATLAB: An Introduction with Applications
6th Edition
ISBN:9781119256830
Author:Amos Gilat
Publisher:Amos Gilat
Chapter1: Starting With Matlab
Section: Chapter Questions
Problem 1P
icon
Related questions
Question

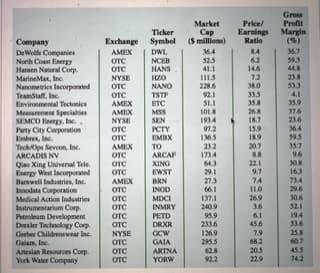
The following table shows a data set containing information for 25 of the shadow stocks tracked by the American Association of Individual Investors (aaii.com, February 2002). Shadow stocks are common stocks of smaller companies that are not closely followed by Wall Street analysts. The data set is also on the website that accompanies the text in the file named Shadow02.


a. How many elements are in this data set?


b. Of the following subset of variables, indicate which are categorical and which are quantitative:

Exchange       ["quantative", "categorical"]  ,

Price/Earnings Ratio       ["quantitive", "categorical"]  ,

Gross Profit Margin.      ["quantitive", "categorical"] 


c.

Indicate the scale of  measurement for the variables: Exchange, Price/Earnings Ratio, Gross Profit Margin (%):

Exchange is      ["ratio scale", "interval scale", "ordinal scale", "nomial scale"] 

Price/Earnings Ratio  is      ["ratio scale", "interval scale", "ordinal scale", "nomial scale"] 

Gross Profit Margin (%) is       ["ratio scale", "interval scale", "ordinal scale", "nomial scale"]  .


Company
DeWolle Companies
North Coast Energy
Hansen Natural Corp.
MarineMax, Inc.
Nanometrics Incorporated
TeamStaff, Inc.
Environmental Tectonics
Measurement Specialties
SEMCO Energy, Inc.,
Party City Corporation
Embrex, Inc.
Tech/Ops Sevcon, Inc.
ARCADIS NV
Qiao Xing Universal Tele
Energy West Incorporated
Barnwell Industries, Inc.
Innodata Corporation
Medical Action Industries
Instrumentarium Corp.
Petroleum Development
Drexler Technology Corp.
Gerber Childrenswear Inc.
Gaia, Inc.
Artesian Resources Corp.
York Water Company
Exchange
AMEX
отс
OTC
NYSE
OTC
OTC
AMEX
AMEX
NYSE
OTC
отс
AMEX
OTC
OTC
OTC
AMEX
OTC
отс
отс
OTC
OTC
NYSE
отс
OTC
OTC
Ticker
Symbol
DWL
NCEB
HANS
HZO
NANO
TSTF
ETC
MSS
SEN
PCTY
EMBX
TO
ARCAP
XING
EWST
BRN
INOD
MDCI
INMRY
PETD
DRXR
GCW
GAIA
ARTNA
YORW
Market
Cap
($millions)
36.4
52.5
41.1
1115
228.6
92.1
51.1
101.8
193.4
97.2
136.5
23.2
1734
64.3
29.1
27.3
66.1
137.1
240.9
95.9
233.6
126.9
295.5
62.8
92.2
Price/
Earnings
Ratio
8.4
6.2
14.6
7.2
38.0
33.5
35.8
26.8
18.7
15.9
18.9
20.7
8.8
22.1
9.7
74
11.0
26.9
3.6
6.1
45.6
7.9
68.2
20.5
22.9
Gross
Profit
Margin
36.7
59.3
44.8
23.8
53.3
4.1
35.9
37.6
23.6
36.4
59.5
35.7
9.6
30.8
163
73.4
29.6
30.6
52.1
19.4
53.6
25.8
60.7
45.5
74.2
Transcribed Image Text:Company DeWolle Companies North Coast Energy Hansen Natural Corp. MarineMax, Inc. Nanometrics Incorporated TeamStaff, Inc. Environmental Tectonics Measurement Specialties SEMCO Energy, Inc., Party City Corporation Embrex, Inc. Tech/Ops Sevcon, Inc. ARCADIS NV Qiao Xing Universal Tele Energy West Incorporated Barnwell Industries, Inc. Innodata Corporation Medical Action Industries Instrumentarium Corp. Petroleum Development Drexler Technology Corp. Gerber Childrenswear Inc. Gaia, Inc. Artesian Resources Corp. York Water Company Exchange AMEX отс OTC NYSE OTC OTC AMEX AMEX NYSE OTC отс AMEX OTC OTC OTC AMEX OTC отс отс OTC OTC NYSE отс OTC OTC Ticker Symbol DWL NCEB HANS HZO NANO TSTF ETC MSS SEN PCTY EMBX TO ARCAP XING EWST BRN INOD MDCI INMRY PETD DRXR GCW GAIA ARTNA YORW Market Cap ($millions) 36.4 52.5 41.1 1115 228.6 92.1 51.1 101.8 193.4 97.2 136.5 23.2 1734 64.3 29.1 27.3 66.1 137.1 240.9 95.9 233.6 126.9 295.5 62.8 92.2 Price/ Earnings Ratio 8.4 6.2 14.6 7.2 38.0 33.5 35.8 26.8 18.7 15.9 18.9 20.7 8.8 22.1 9.7 74 11.0 26.9 3.6 6.1 45.6 7.9 68.2 20.5 22.9 Gross Profit Margin 36.7 59.3 44.8 23.8 53.3 4.1 35.9 37.6 23.6 36.4 59.5 35.7 9.6 30.8 163 73.4 29.6 30.6 52.1 19.4 53.6 25.8 60.7 45.5 74.2
Expert Solution
steps

Step by step

Solved in 2 steps

Blurred answer
Similar questions
  • SEE MORE QUESTIONS
Recommended textbooks for you
MATLAB: An Introduction with Applications
Statistics
ISBN:
9781119256830
Author:
Amos Gilat
Publisher:
John Wiley & Sons Inc
Probability and Statistics for Engineering and th…
Statistics
ISBN:
9781305251809
Author:
Jay L. Devore
Publisher:
Cengage Learning
Statistics for The Behavioral Sciences (MindTap C…
Statistics
ISBN:
9781305504912
Author:
Frederick J Gravetter, Larry B. Wallnau
Publisher:
Cengage Learning
Elementary Statistics: Picturing the World (7th E…
Statistics
ISBN:
9780134683416
Author:
Ron Larson, Betsy Farber
Publisher:
PEARSON
The Basic Practice of Statistics
Statistics
ISBN:
9781319042578
Author:
David S. Moore, William I. Notz, Michael A. Fligner
Publisher:
W. H. Freeman
Introduction to the Practice of Statistics
Statistics
ISBN:
9781319013387
Author:
David S. Moore, George P. McCabe, Bruce A. Craig
Publisher:
W. H. Freeman