a. Locate and interpret the 90% confidence interval for mean fasting blood sugar on the printout. b. Locate and interpret the 90% confidence interval for mean magnesium level on the printout. c. If the confidence level is increased to 95%, what will - happen to the width of the intervals? d. If the sample of hypertensive patients is increased from 50 to 100, what will likely happen to the width of the intervals? NW
Q: The figure to the right shows the results of a survey in which 1013 adults from Country A, 1001…
A:
Q: 6. Use the data to construct a 99% confidence interval for the true difference in hemoglobin level…
A: Instruction : "I need help with question 6 plz." Given Data :
Q: Which of the following is thet-value for a 95% confidence level when the sample size is 20. O a.…
A:
Q: (a) How many subjects are needed to estimate the mean number of books read the previous year within…
A: Here use formula of margin of error
Q: Use the given confidence interval to find the margin of error and the sample proportion.…
A: From the provided information, Confidence interval is (0.751, 0.777)
Q: Determine the margin of error for a confidence interval to estimate the population mean with n = 21…
A: n = 21 s = 12.6 confidence interval = 80%.
Q: The figure to the right shows the results of a survey in which 1003 adults from Country A, 1024…
A: Given information For country A p-hat = 0.35 n = 1003
Q: 3. Use the t-distribution table to determine the value of t to construct confidence interval for the…
A: Hello! As you have posted more than 3 sub parts, we are answering the first 3 sub-parts. In case…
Q: Construct the indicated confidence interval for the population mean . Assume c = 0.98, = 101.3, =…
A:
Q: (d) How many subjects are needed to estimate the mean number of books read the previous year within…
A: (d) The mean number if books read the previous year within four books, and standard deviation is13.3…
Q: The Municipal Transit Authority wants to know if, on weekdays, more passengers ride the north bound…
A: Given information- We have given two sample of the 8:15 train and 8:30 train. Sample 1 for 8:15…
Q: Construct the 94% confidence interval estimate of the population proportion ? if the sample size is…
A:
Q: c. What is the margin of error for a 90% confidence interval estimate for the difference between the…
A: Given data: First round Final round 71 75 69 68 69 66 73 76 69 72 69 75 72 72 69…
Q: d. Suppose the ecologist ends up sampling n = 9 alligators and calculates a sample mean of =…
A: confidence interval calculation
Q: The figure to the right shows the results of a survey in which 1003 adults from Country A, 1024…
A: Given information For country A p-hat = 0.35 n = 1003
Q: Use the given confidence interval to find the margin of error and thr sample mean. (5.42, 8.56)
A: Obtain the value of margin of error using the confidence limits. The value of the margin of error…
Q: The figure to the right shows the results of a survey in which 1003 adults from Country A, 1024…
A: Given information For country A p-hat = 0.35 n = 1003
Q: Construct the 95% confidence interval estimate of the population proportion ? if the sample size is…
A: Given Data Sample Size, n = 400 Number of successes, x = 52.0 confidence level,c=…
Q: For a population data set, ở a. What should the sample size be for a 97 % confidence interval for u…
A:
Q: The figure to the right shows the results of a survey in which 1010 adults from Country A, 996…
A:
Q: If you obtained one thousand 95% confidence intervals for a population mean, µ, roughly how m the…
A: f you obtained one thousand 95% confidence intervals for a population mean, roughly it contains…
Q: A college admissions officer takes a simple random sample of 90 entering freshmen and computes their…
A: The correct option is: C) No.Given information:
Q: Which of the following would result in the widest confidence interval? O A sample size of 30 with…
A:
Q: Assume that a sample is being used to estimate a population mean μμ. If n = 29, x¯ = 46, and s =…
A: From the provided information, Sample size (n) = 29 Sample mean (x̅) = 46 Sample standard deviation…
Q: (b) Use a 99% confidence interval to estimate the mean percent change in the population. FILE O…
A: (b) The mean percent is, x¯=∑xn=-4.7-2.5-4.9-2.7+⋯-5.147=-168.647=-3.5872 The mean percent is…
Q: find the indicated z value of z α/2 that corresponds to the confidence level of 89.43%
A: Solution: From the given information, the confidence level is 89.43%. The critical value can be…
Q: (d) How many subjects are needed to estimate the mean number of books read the previous year within…
A: (d)
Q: c.) What is the 90% confidence interval estimate of the mean temperature in July for the city? O…
A: Given that Sample size n =17 Sample mean =99.1 Standard deviation =4.8
Q: Use the given confidence interval to find the margin of error and the sample mean. (4.81, 8.09)
A: The confidence interval is given by (4.81, 8.09)
Q: The figure to the right shows the results of a survey in which 996 adults from Country A, 1006…
A:
Q: If a corporation wishes to construct a 95% confidence interval for the proportion of all adolescent…
A:
Q: a. What should the sample size be for a 98% confidence interval for p to have a margin of error of…
A: Given: σ=17.40
Q: a) How large a sample is required to obtain a 95% confidence interval with a margin of error of 2…
A: Given that Sample standard deviation s=7.5 But here i m using estimated standard deviation ?=7.5…
Q: 14. Find the sample size that will produce the maximum error of a 99% confidence interval for a…
A:
Q: c. If many groups of 10 randomly selected children with Tourette syndrome are observed, then a…
A: As per the instruction , only part c is asked and also part a a) Since , the population standard…
Q: Suppose that Randy is an analyst for the bicyling industry and wants to estimate the asking price of…
A: Since the population standard deviation is unknown, t distribution can be used for the computation…
Q: Find the margin of error for the given 1. o = 3.5 n = 45 a. 90% confidence level
A: To find the margin of error for the given confidence levels: Margin of error indicates how many…
Q: ence interval for a population mean, compute the margin of error, E. 11.00<μ<13.1411.00<μ<13.14
A: Given the confidence interval 11.00<μ<13.14 Computing the Margin of error is given as below:
Q: The U.S. Department of the Interior is checking cattle on the Windgate open range in Montana. A…
A:
Q: Which of the following t values would be used to construct a 99% confidence interval for the mean…
A: Given: sample size n = 17 level of significance = 0.01 two tailed test
Q: Suppose that Randy is an analyst for the bicyling industry and wants to estimate the asking price of…
A: From the given information, n=13x¯=681.87s=177.45 confidence level=99% significance level 1% degrees…
Q: 4) Consider a confidence level of 90%. If n=68 and ?̂ = 0.42 Calculate the margin of error. 5)…
A: According to our guidelines we can answer only first question and rest can be reposted.
Q: Use the given confidence interval to find the margin of error and the sample mean. (13.5,21.9)
A: Given confidence interval (13.5, 21.9)
Q: d) Assume that the weight of some item is normally distributed with mean µ and standard deviation…
A:
Q: The figure to the right shows the results of a survey in which 1003 adults from Country A, 1024…
A: Given information For country A p-hat = 0.35 n = 1003
Q: The figure to the right shows the results of a survey in which 1003 adults from Country A, 1024…
A: Given information For country A p-hat = 0.35 n = 1003
Q: 17. Cora wants to determine a 80 percent confidence interval for the true proportion p of high…
A:
Q: ind the point estimate, the standard error, and the margin of error for the given confidence levels…
A: The provided information is n=80 x=29 C=0.92 α=0.08 The critical value is zc= ±1.7507 (from…
Q: Construct a 99% confidence interval of the mean drive-through service times at dinner for…
A: The data about the drive-through service time for Restaurant X and for Restaurant Y is given as…
Please solve for all parts
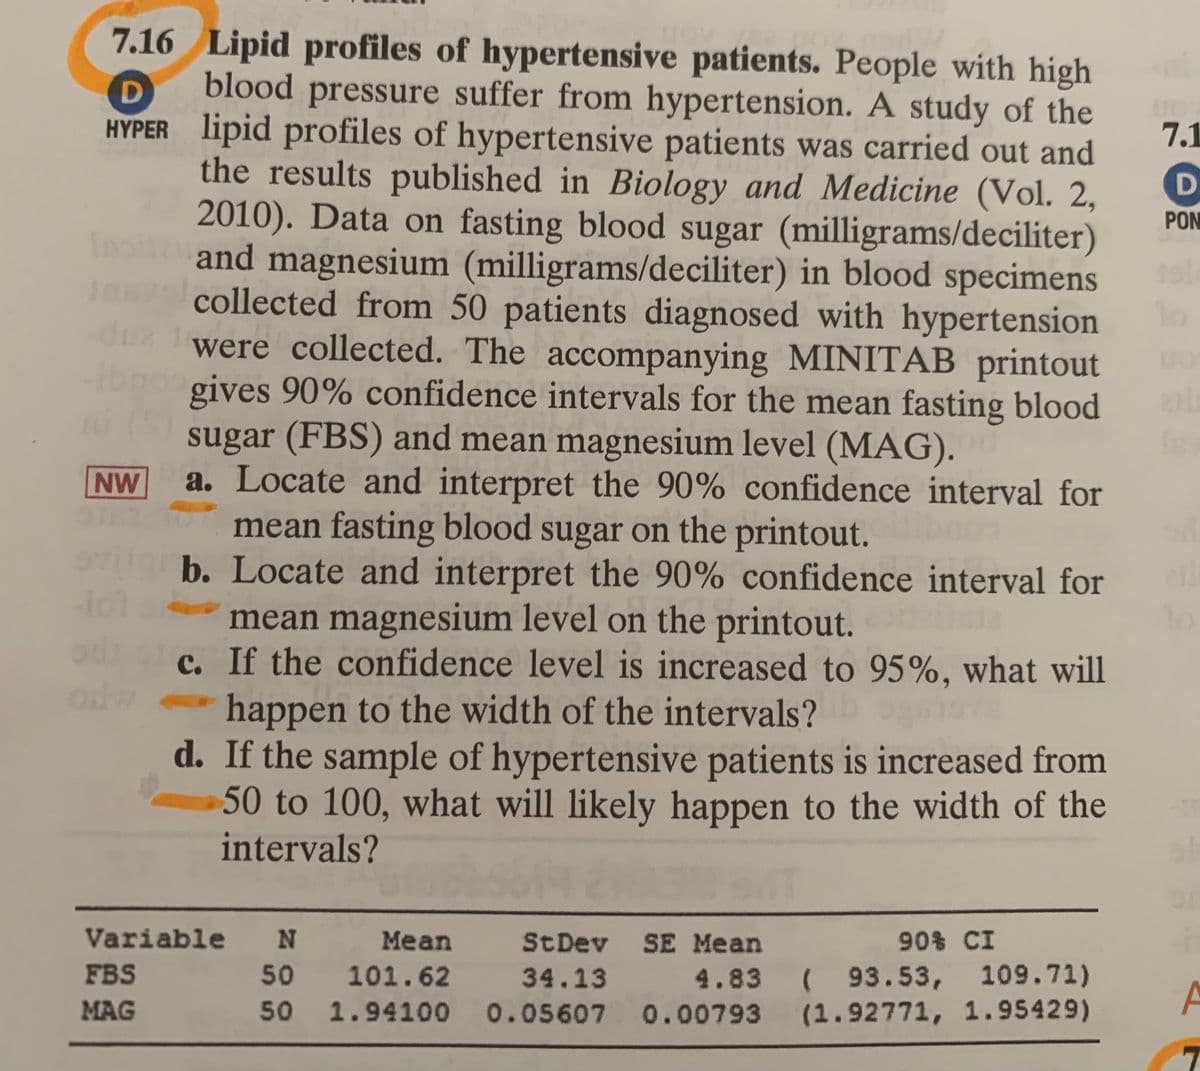
Trending now
This is a popular solution!
Step by step
Solved in 4 steps with 1 images
- Lactation promotes a temporary loss of bone mass to provide adequate amounts of calcium for milk production. The paper “Bone Mass Is Recovered from Lactation to Postweaning in Adolescent Mothers with Low Calcium Intakes” (Amer. J. of Clinical Nutr., 2004: 1322–1326) gave the following data on total body bone mineral content (TBBMC) (g) for a sample both during lactation (L) and in the postweaning period (P). SubjectL 1928 2549 2825 1924 1628 2175 2114 2621 1843 2541P 2126 2885 2895 1942 1750 2184 2164 2626 2006 2627 Does the data suggest that true average total body bone mineral content during postweaning exceeds that during lactation by more than 25 g? State and test the appropriate hypotheses using a significance level of .05.Cadmium, a heavy metal, is toxic to animals. Mushrooms, however, are able to absorb and accumulate cadmium at high concentrations. The Czech and Slovak governments have set a safety limit for cadmium in dry vegetables at 0.5 part per million (ppm). M. Melgar et al. measured the cadmium levels in a random sample of the edible mushroom Boletus pinicola and published the results in the paper “Influence of Some Factors in Toxicity and Accumulation of Cd from Edible Wild Macrofungi in NW Spain” (Journal of Environmental Science and Health, Vol. B33(4), pp. 439–455). A hypothesis test is to be performed to decide whether the mean cadmium level in Boletus pinicola mushrooms is greater than the government’s recommended limit. Hypothesis tests are proposed. For each hypothesis test,a. determine the null hypothesis.b. determine the alternative hypothesis.c. classify the hypothesis test as two tailed, left tailed, or right tailed.Suppose a researcher is interested inthe effectiveness in a new childhood exercise program implemented in a SRS of schools across a particular county. In order to test the hypothesis that the new program decreases BMI (Kg/m2), the researcher takes a SRS of children from schools where the program is employed and a SRS from schools that do not employ the program and compares the results. Assume the following table represents the SRSs of students and their BMIs. Student intervention group BMI (kg/m2) Student control group BMI (kg/m2) A 18.6 A 21.6 B 18.2 B 18.9 C 19.5 C 19.4 D 18.9 D 22.6 E 24.1 F 23.6 A) Assuming that all the necessary conditions are met (normality, independence, etc.) carry out the appropriate statistical test to determine if the new exercise program is effective. Use an alpha level of 0.05. Do not assume equal variances.B) Construct a 95% confidence interval about your estimate for the average difference in BMI between the groups.
- A deficiency of the trace element selenium in the diet can negatively impact growth, immunity, muscle and neuromuscular function, and fertility. The introduction of selenium supplements to dairy cows is justified when pastures have low selenium levels. Authors of the article “Effects of Short-Term Supplementation with Selenised Yeast on Milk Production and Composition of Lactating Cows” (Australian J. of Dairy Tech., 2004: 199–203) supplied the following data on milk selenium concentration (mg/L) for a sample of cows given a selenium supplement and a control sample given no supplement, both initially and after a 9-day period. Obs Init Se Init Cont Final Se Final Cont 1 11.4 9.1 138.3 9.3 2 9.6 8.7 104 8.8 3 10.1 9.7 96.4 8.8 4 8.5 10.8 89 10.1 5 10.3 10.9 88 9.6 6 10.6 10.6 103.8 8.6 7 11.8 10.1 147.3 10.4 8 9.8 12.3 97.1 12.4 9 10.9 8.8 172.6 9.3 10 10.3…A researcher wanted to determine if carpeted rooms contain more bacteria than uncarpeted rooms. The table shows the results for the number of bacteria per cubic foot for both types of rooms. Full data set Carpeted Uncarpeted 7.5 14.9 9.4 5.1 10.6 4.2 9.2 12.7 9.9 13.3 9.3 4.2 6.9 11.1 7.5 12.5 Determine whether carpeted rooms have more bacteria than uncarpeted rooms at the α=0.05 level of significance. Normal probability plots indicate that the data are approximately normal and boxplots indicate that there are no outliers. State the null and alternative hypotheses. Let population 1 be carpeted rooms and population 2 be uncarpeted rooms. A. H0: μ1=μ2 H1: μ1>μ2 This is the correct answer. B. H0: μ1<μ2 H1: μ1>μ2 C. H0: μ1=μ2 H1: μ1≠μ2 D. H0: μ1=μ2 H1: μ1<μ2 Your answer is not correct. Determine the P-value for this hypothesis test. P-value=nothing…Q3. Kaimura et al. (2000) investigated the effects of procyanidin B-2 tonic on human hair growth after sequential use for 6 months. In one part of the study, the total hair increase (total hairs at month 6 – total hairs at month 0) in the designated scalp area was measured for a sample of 15 men treated with a placebo control and a sample of 25 men treated with a procyanidin B-2 (PB2). The data is contained in the file A2Q3.csv. (This data is simulated based on information in the paper. You must use the data in the file to carry out the analysis). Is there evidence that the total hair increase of the subjects in the procyanidin B-2 group was greater the those in the placebo control group, at the 5% level of significance? State an appropriate null and alternative hypothesis in words and symbols.
- Low-Birth-Weight Hospital Stays. Data on low-birthweight babies were collected over a 2-year period by 14 participating centers of the National Institute of Child Health and Human Development Neonatal Research Network. Results were reported by J. Lemons et al. in the on-line paper “Very Low Birth Weight Outcomes of the National Institute of ChildHealth and Human Development Neonatal Research Network” (Pediatrics, Vol. 107, No. 1, p. e1). For the 1084 surviving babies whose birth weights were 751– 1000 grams, the average length of stay in the hospital was 86 days, although one center had an average of 66 days and another had an average of 108 days. a. Can the mean lengths of stay be considered population means? Explain your answer.b. Assuming that the population standard deviation is 12 days, determine the z-score for a baby’s length of stay of 86 days at the center where the mean was 66 days.c. Assuming that the population standard deviation is 12 days, determine the z-score for a…A deficiency of the trace element selenium in the diet can negatively impact growth, immunity, muscle and neuromuscular function, and fertility. The introduction of selenium supplements to dairy cows is justified when pastures have low selenium levels. Authors of a research paper supplied the following data on milk selenium concentration (mg/L) for a sample of cows given a selenium supplement (the treatment group) and a control sample given no supplement, both initially and after a 9-day period. Initial Measurement Treatment Control 11.2 9.1 9.6 8.7 10.1 9.7 8.5 10.8 10.3 10.9 10.6 10.6 11.7 10.1 9.7 12.3 10.8 8.8 10.3 10.4 10.4 10.9 11.2 10.4 9.4 11.6 10.6 10.9 10.7 8.4 After 9 Days Treatment Control 138.3 9.3 104 8.7 96.4 8.7 89 10.1 88 9.6 103.8 8.6 147.3 10.2 97.1 12.2 172.6 9.3 146.3 9.5 99 8.2 122.3 8.9 103 12.5 117.8 9.1 121.5 93 (a) Use the given data for the treatment group to determine if there…A deficiency of the trace element selenium in the diet can negatively impact growth, immunity, muscle and neuromuscular function, and fertility. The introduction of selenium supplements to dairy cows is justified when pastures have low selenium levels. Authors of a research paper supplied the following data on milk selenium concentration (mg/L) for a sample of cows given a selenium supplement (the treatment group) and a control sample given no supplement, both initially and after a 9-day period. Initial Measurement Treatment Control 11.3 9.1 9.7 8.7 10.1 9.7 8.5 10.8 10.4 10.9 10.7 10.6 11.8 10.1 9.8 12.3 10.6 8.8 10.4 10.4 10.2 10.9 11.3 10.4 9.2 11.6 10.7 10.9 10.8 8.2 After 9 Days Treatment Control 138.3 9.4 104 8.8 96.4 8.8 89 10.1 88 9.7 103.8 8.7 147.3 10.3 97.1 12.3 172.6 9.4 146.3 9.5 99 8.3 122.3 8.9 103 12.5 117.8 9.1 121.5 93 (a) Use the given data for the treatment group to determine if…
- A deficiency of the trace element selenium in the diet can negatively impact growth, immunity, muscle and neuromuscular function, and fertility. The introduction of selenium supplements to dairy cows is justified when pastures have low selenium levels. Authors of a research paper supplied the following data on milk selenium concentration (mg/L) for a sample of cows given a selenium supplement (the treatment group) and a control sample given no supplement, both initially and after a 9-day period. Initial Measurement Treatment Control 11.4 9.1 9.6 8.7 10.1 9.7 8.5 10.8 10.2 10.9 10.6 10.6 11.9 10.1 9.9 12.3 10.7 8.8 10.2 10.4 10.3 10.9 11.4 10.4 9.3 11.6 10.6 10.9 10.9 8.3 After 9 Days Treatment Control 138.3 9.2 104 8.9 96.4 8.9 89 10.1 88 9.6 103.8 8.6 147.3 10.4 97.1 12.4 172.6 9.2 146.3 9.5 99 8.4 122.3 8.8 103 12.5 117.8 9.1 121.5 93 (a) Use the given data for the treatment group to determine if…Stressed-Out Bus Drivers. Previous studies have shown that urban bus drivers have an extremely stressful job, and a large proportion of drivers retire prematurely with disabilities due to occupational stress. In the paper, “Hassles on the Job: A Study of a Job Intervention With Urban Bus Drivers” (Journal of Organizational Behavior, Vol. 20, pp. 199–208), G. Evans et al. examined the effects of an intervention program to improve the conditions of urban bus drivers.Amongother variables, the researchers monitored diastolic blood pressure of bus drivers in downtown Stockholm, Sweden. The data, in millimeters of mercury (mm Hg), on the WeissStats site are based on the blood pressures obtained prior to intervention for the 41 bus drivers in the study. Use the technology of your choice to do the following. a. Obtain a normal probability plot, boxplot, histogram, and stemand-leaf diagram of the data. b. Based on your results from part (a), can you reasonably apply the one-mean t-test to the…Listed below are amounts of strontium-90 (in millibecquerels, or mBq, per gram of calcium) in a simple random sample by baby teeth obtained from Pennsylvania residents and New York residents born after 1979. Use a 0.05 significance level and Wilcoxon rank-sum test to test the claim that the median amount of strontium-90 from Pennsylvania residents is the same as the median from New York residents. Pennsylvania 155 142 149 130 151 163 151 142 156 133 138 161 New York 133 140 142 131 134 129 128 140 140 140 137 143 1. what is the exact value of R = R 1 (Pennsylvania)? (Round off to 1 decimal place.) 2. what is the value of μ R ? (Type as a whole number.) 3. what is the value of σ R ? (Round off to 2 decimal places.) 4. what is the computed value of z ? (Round off to 2 decimal places.) 5. what is the tabular value of z ? (Round off to 2 decimal places.