a. Plot these data and determine whether a linear model is reasonable. b. Develop a regression model. c. What is expected ridership if 10 million tourists visit the city?
a. Plot these data and determine whether a linear model is reasonable. b. Develop a regression model. c. What is expected ridership if 10 million tourists visit the city?

Functions and Change: A Modeling Approach to College Algebra (MindTap Course List)
6th Edition
ISBN:9781337111348
Author:Bruce Crauder, Benny Evans, Alan Noell
Publisher:Bruce Crauder, Benny Evans, Alan Noell
Chapter5: A Survey Of Other Common Functions
Section5.3: Modeling Data With Power Functions
Problem 6E: Urban Travel Times Population of cities and driving times are related, as shown in the accompanying...

Related questions
Question
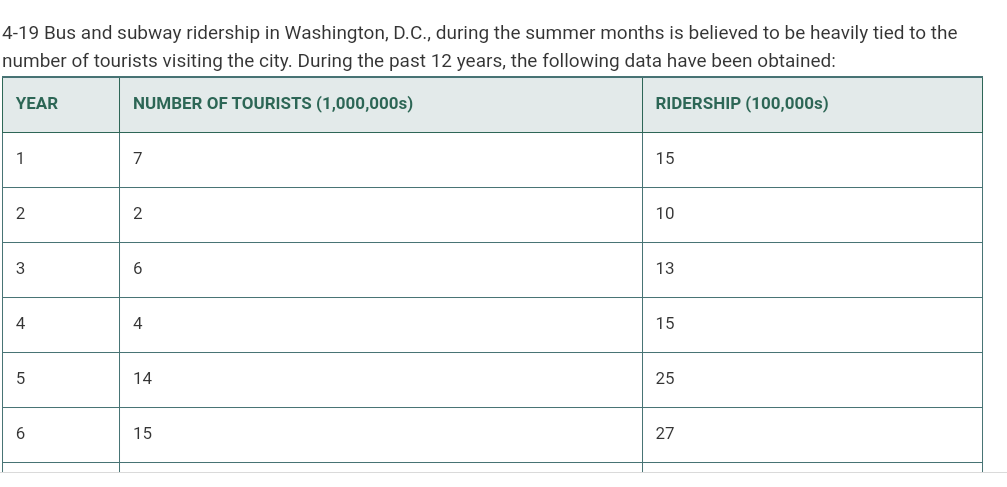
Transcribed Image Text:4-19 Bus and subway ridership in Washington, D.C., during the summer months is believed to be heavily tied to the
number of tourists visiting the city. During the past 12 years, the following data have been obtained:
YEAR
NUMBER OF TOURISTS (1,000,000s)
RIDERSHIP (100,000s)
7
15
2
2
10
3
6
13
4
4
15
14
25
15
27
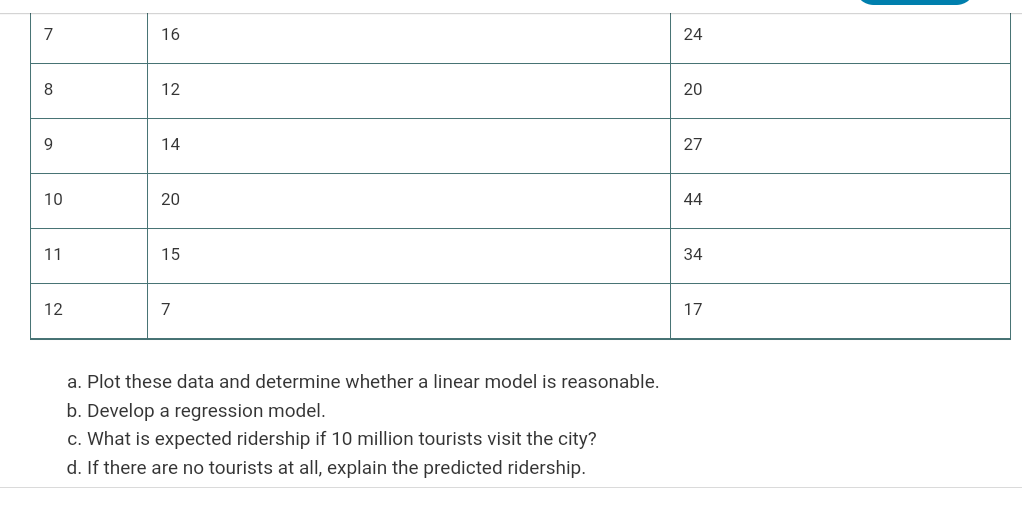
Transcribed Image Text:7
16
24
8
12
20
9
14
27
10
20
44
11
15
34
12
17
a. Plot these data and determine whether a linear model is reasonable.
b. Develop a regression model.
c. What is expected ridership if 10 million tourists visit the city?
d. If there are no tourists at all, explain the predicted ridership.
Expert Solution
This question has been solved!
Explore an expertly crafted, step-by-step solution for a thorough understanding of key concepts.

This is a popular solution!

Trending now
This is a popular solution!

Step by step
Solved in 2 steps with 1 images

Recommended textbooks for you
Functions and Change: A Modeling Approach to Coll…
Algebra
ISBN:
9781337111348
Author:
Bruce Crauder, Benny Evans, Alan Noell
Publisher:
Cengage Learning
Functions and Change: A Modeling Approach to Coll…
Algebra
ISBN:
9781337111348
Author:
Bruce Crauder, Benny Evans, Alan Noell
Publisher:
Cengage Learning