a. The equation for a line of regression, ŷ = a + bx, is: bırth rate = a + bgnp where gnp is the explanatory variable for the birth rate, the response variable. Using the summary statistics given above, show how to calculate both the slope coefficient and the intercept (do not round any numbers until the end). Show all working out. The estimates of a and b (correct to 4 d.p.) from the above dataset are: a = 47.1821 b= -0.0064
a. The equation for a line of regression, ŷ = a + bx, is: bırth rate = a + bgnp where gnp is the explanatory variable for the birth rate, the response variable. Using the summary statistics given above, show how to calculate both the slope coefficient and the intercept (do not round any numbers until the end). Show all working out. The estimates of a and b (correct to 4 d.p.) from the above dataset are: a = 47.1821 b= -0.0064

Glencoe Algebra 1, Student Edition, 9780079039897, 0079039898, 2018
18th Edition
ISBN:9780079039897
Author:Carter
Publisher:Carter
Chapter10: Statistics
Section10.4: Distributions Of Data
Problem 19PFA

Related questions

Question
Please help awnser question f on the attached pictures all necessary data is there
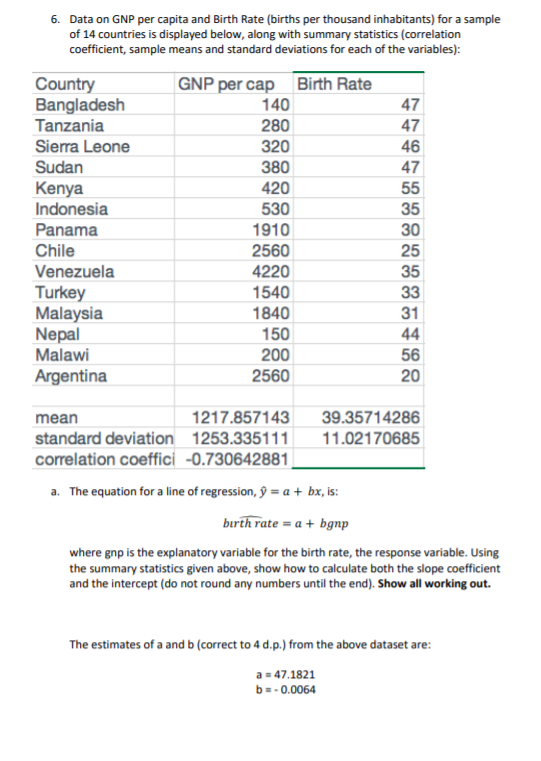
Transcribed Image Text:6. Data on GNP per capita and Birth Rate (births per thousand inhabitants) for a sample
of 14 countries is displayed below, along with summary statistics (correlation
coefficient, sample means and standard deviations for each of the variables):
Country
Bangladesh
Tanzania
Sierra Leone
Sudan
GNP per cap
140
Birth Rate
47
280
47
320
46
380
47
Kenya
Indonesia
420
55
530
35
Panama
1910
30
Chile
2560
25
Venezuela
4220
35
Turkey
Malaysia
Nepal
Malawi
1540
33
1840
31
150
44
200
56
Argentina
2560
20
1217.857143
standard deviation 1253.335111
correlation coeffici -0.730642881,
mean
39.35714286
11.02170685
a. The equation for a line of regression, ŷ = a + bx, is:
bırth rate = a + bgnp
where gnp is the explanatory variable for the birth rate, the response variable. Using
the summary statistics given above, show how to calculate both the slope coefficient
and the intercept (do not round any numbers until the end). Show all working out.
The estimates of a and b (correct to 4 d.p.) from the above dataset are:
a = 47.1821
b=- 0.0064
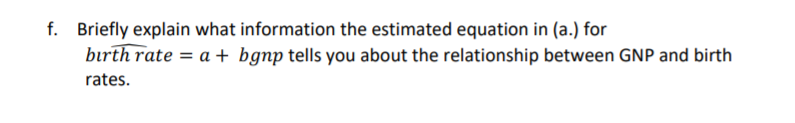
Transcribed Image Text:f. Briefly explain what information the estimated equation in (a.) for
bırth rate = a + bgnp tells you about the relationship between GNP and birth
rates.
Expert Solution
This question has been solved!
Explore an expertly crafted, step-by-step solution for a thorough understanding of key concepts.

Step by step
Solved in 2 steps with 1 images

Knowledge Booster


Learn more about
Need a deep-dive on the concept behind this application? Look no further. Learn more about this topic, statistics and related others by exploring similar questions and additional content below.Recommended textbooks for you
Glencoe Algebra 1, Student Edition, 9780079039897…
Algebra
ISBN:
9780079039897
Author:
Carter
Publisher:
McGraw Hill
Glencoe Algebra 1, Student Edition, 9780079039897…
Algebra
ISBN:
9780079039897
Author:
Carter
Publisher:
McGraw Hill