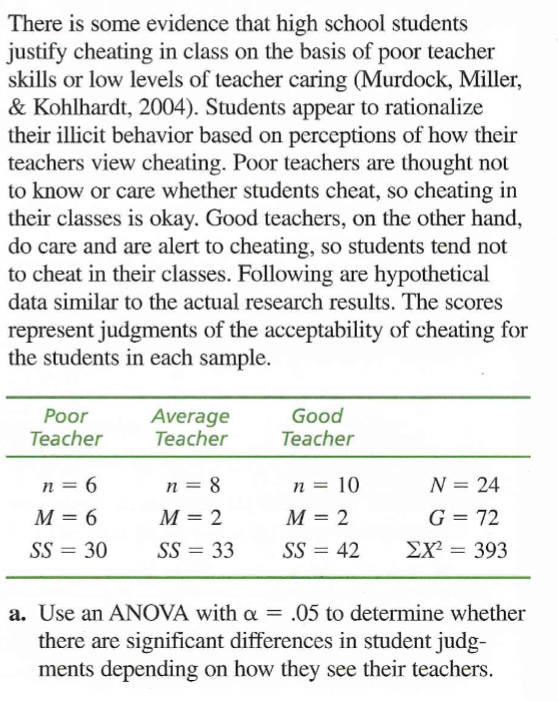
a. Use an ANOVA with a = .05 to determine whether there are significant differences in student judg- ments depending on how they see their teachers.


Q: _________are computed to show cause and effect relationships and to test hypotheses and scientific…
A: Causation indicates the relationship between two events where one event causes another event to…
Q: Imagine a study comparing two groups: undergrad vs. graduate students in terms of stress level. To…
A: Provided that here is a study comparing two independent groups : undergrad vs. graduate students in…
Q: Based on the boxplot and descriptive statistics, which group shows more variability in narcissism…
A:
Q: Complete the following ANOVA summary table for a two-factor fixed-effects ANOVA, w
A: Number of level of factor A = a = 4 Number of level of factor B = b = 7 Number of observations per…
Q: Could two samples have the same range but different means? Explain.
A: Yes, Two samples have the same range but different means.
Q: Provide an example of a study in which an independent measures ANOVA would be warranted ?
A: Introduction: The ANOVA or analysis of variance is a parametric method of hypothesis testing,…
Q: The following data summarize results from independent measures study comparing three treatment…
A: The information on the data is given by: 1 2 3 n=5 n=5 n=5 M=1 M=5 M=6 N=15 T=5 T=25…
Q: . May conducts a design of experiment and the following is the result of ANOVA analysis. The esult…
A: Given information: The results of ANOVA analysis for the design of experiment conducted by May is…
Q: Does the one observed sample mean qualify as a common or a rare outcome? Explain.
A: Sample mean qualify as a common outcome if the difference between the sample mean and the actual or…
Q: What is an unusually small or unusually large data value called? a. outlier b. sample statistic C.…
A: an unusually small or unusually large data value is called ?
Q: Stacy conducts a study to look at the effects of season (fall, winter, spring, summer) and type of…
A: Two way ANOVA: From the given information, the data view of the given variables is, fall…
Q: Given the results of the ANOVA (in the picture), which of the following is NOT correct?
A: Decision rule: If F-statistic is greater than F-crit, the null hypothesis is rejected. If…
Q: In your own words, distinguish between measures of association and tests of statistical…
A: The measures of association terms generally used for the correlation coefficient. The correlation…
Q: Is there a relationship between scores on the combat exposure scale and Davidson trauma scale in a…
A: One should first know the definitions of these scales before proceeding with the answer. Combat…
Q: What proportion of the sample reported that they had been cyberbullied?
A: Givensample size(n)=14795No.of respondents say yes they had been cyberbullied(x1) = 2219No.of…
Q: Is the Chebyshev's rule used only with populations? Are samples used as well?
A: Yes, Chebyshev’s rule can be applied to population as well as sample.We should know the following…
Q: Are these samples independent or paired?
A: When the two observations are taken on same individual then the samples are said to be paired.
Q: Is there a link between exercise and level of education? Independent random samples of adults from…
A: a. From the given information, the level of significance is 5% or 0.05. b. Null Hypothesis:…
Q: Answer the following questions about an ANOVA analysis involving three samples. d. In an ANOVA…
A: Null Hypothesis: H0: μ1= μ2= μ3 There is no significant difference between means of three…
Q: With mound-shaped data, what proportion of the mea- surements have z-scores between-3 and 3?
A: From the provided information, The data is mound shaped. A mound shaped data is sometimes called…
Q: In which situation would a researcher need to use a one-way independent measures ANOVA to analyze…
A: In situation b researcher need to use one-way independent measures ANOVA to analyse data. Here…
Q: The following question is from Interpreting Basic Statistics by Holcomb 8th edition: - How many…
A: Given Theoretical question
Q: In one-way ANOVA, identify a statistic that measures a. the variation among the sample means. b. the…
A: From the given information, In one-way ANOVA, the required statistics that measures the variation…
Q: A researcher studying psychological well-being between those with depression, anxiety, or mood…
A: Given Information- Number of individuals for each type of psychological well-being are Depression =…
Q: Does the data from the sample support his claim at a significance level of 0.05?
A: It is given that Sample size n = 60 Sample mean M = 3012 Sample SD s = 112 Level of significance =…
Q: What is the formula for STANDARDIZED EFFECT SIZE, COHEN’S d (TWO INDEPENDENT SAMPLES)?
A:
Q: Dr. Volk wanted to see if there was a significant association between in the number of college…
A: H0 : There is no association between in the number of college students by grade level (Freshman,…
Q: The one-way ANOVA partitions the total variability into into a. Sswithin and MSbetween…
A: Solution: The linear mathematical model for one way ANOVA is yij=μ+αi+εij i=1:k, j=1:nWhere yij = j…
Q: What is the average IQ of these subjects?
A:
Q: In order to determine if there was a relationship between living near power lines and a rare…
A: The objective of this question is to identify the study design to check the relationship between…
Q: Why is it important to report both a measure of central tendency and variability to describe a set…
A: Basic idea about measures of central tendency and dispersion Measure of Central tendency is the…
Q: A relatively elderly county, whose majority of registered voters are Democrats, with a mean…
A:
Q: In one-way ANOVA, the total variation in scores can be divided into two sources ___
A: In general, the total variation in scores can be divided into two sources. They are shown below:
Q: If a researcher failed to use a random sample, how would this affect the research conclusion? If…
A: Any test criteria's basic assumption is to select a sample that is random. A random sample would be…
Q: If you wanted to determine whether mean levels of blood glucose were different according to gender…
A:
Q: 2) A researcher suspects that there is a relationship between substance use and sexual activity…
A: In statistics, for analysis purposes, we collect the data. According to the objective of the survey…
Q: Which of the following is the value of the appropriate test statistic?
A: We will use paired t test to test that whether the training was effective. Let d be the difference…
Q: measure of variability?
A: We know that Mean and Median is used to measure of Central tendency of the given sample data .…
Q: What is the upper quartile of the following data: 4, 1, 4, 3, 6
A: Given that data 4, 1, 4, 3, 6 Formula for upper quartile Q3. Q3=(3(n+1)/4)
Q: Is there a linear association between age and days? Explain using the sample illustration below.
A: Scatter plot is a graph that shows the direction as well as linearity of the relationship between…
Q: 10. If there are 12 numbers in a set of data, the 2nd quartile is the?* 2nd number 5th number…
A:
Q: Measures of central tendency alone are insufficient to completely describe a sample because:
A: Hint: Central value for two samples can be same.
Q: Explain if there was a statistically significant difference between the group means. did you arrive…
A: Test is that whether there was a difference between the three means. Level of significance = 0.01
Q: Suppose you receive the following ANOVA output in this study. What is the correct conclusion about…
A: From the given ANOVA output, the F statistic value is F(2,27) = 4.47 and the Sig. value (p-value) is…
Q: Identify the sources of data for the following cases by writing a tick (V) inside the ta Name…
A: Primary data is the data that is directly collected by the researcher for the first time for the…
Q: Is there truly a significant difference between the two data sets?
A: Test is that whether there is truly significant difference between the two data sets. The test…
Q: In almost all research studies, data are obtained from samples. A. True в. False
A: In almost all the research studies ,data are obtained from the samples True False
Q: The within subjects ANOVA may be used with
A: A one-way repeated measures ANOVA is used to determine whether three or more group means are…
Q: What does statistically significance indicates?
A: Statistical significance: If the chance of occurrence of an event is less than or equal to 5% then…
Can you write it in text please so I can copy and paste it!! Thank you


Trending now
This is a popular solution!

Step by step
Solved in 2 steps

- Under what circumstances is it advisable to switch to a between-subjects design instead of using a within-subjects design? On the other hand, when is it advantageous to use a within subjects design instead of a between subjects design? Use examples in which you really would have the option of using either design, not situations in which only one of these designs is possible.A Pew Research study conducted in 2017 found that approximately 75% of Americans believe that robots and computers might one day do many of the jobs currently done by people.† Suppose we have the following data collected from nurses, tax auditors, and fast-food workers in which a higher score means the person feels his or her job is more likely to be automated. Nurse TaxAuditor Fast-FoodWorker 3 4 5 4 5 8 6 4 6 2 4 8 3 6 5 3 3 6 4 5 6 5 3 4 (a) Use ? = 0.05 to test for differences in the belief that a person's job is likely to be automated for the three professions. State the null and alternative hypotheses. H0: μNurse = μTax auditor = μFast-food worker Ha: μNurse ≠ μTax auditor ≠ μFast-food worker H0: At least two of the population means are equal. Ha: At least two of the population means are different. H0: Not all the population means are equal. Ha: μNurse = μTax auditor = μFast-food worker H0: μNurse = μTax auditor = μFast-food worker Ha:…A consulting firm that surveyed consumers’ holiday shopping behavior found that the percentage of consumers from the US, Canada, and China who said that they planned to spend more on holiday shopping were 40%, 34% and 73%, respectively The survey also found that the percentage of consumers from the US, Canada, and China who said that they were willing to share personal information with retailers in order to receive personalized offers from retailers were 55%, 46% and 72%, respectively Assume that there are equal portions of consumers being surveyed from each of the three countries, the survey results are good representations of the three populations of consumers, and whether a consumer plans to spend more on holiday shopping is statistically independent of whether he/she is willing to share personal information with retailers in order to receive personalized offers from retailers If you randomly select a consumer from the US, what is the probability that the consumer plans to…
- A Pew Research study conducted in 2017 found that approximately 75% of Americans believe that robots and computers might one day do many of the jobs currently done by people.† Suppose we have the following data collected from nurses, tax auditors, and fast-food workers in which a higher score means the person feels his or her job is more likely to be automated. Nurse TaxAuditor Fast-FoodWorker 4 4 5 4 5 8 5 6 6 2 3 8 2 6 5 3 3 6 4 5 5 6 2 5 (a)Use ? = 0.05 to test for differences in the belief that a person's job is likely to be automated for the three professions. State the null and alternative hypotheses. 1. H0: μNurse = μTax auditor = μFast-food worker Ha: Not all the population means are equal. 2. H0: Not all the population means are equal. Ha: μNurse = μTax auditor = μFast-food worker 3. H0: At least two of the population means are equal. Ha: At least two of the population means are different. 4. H0: μNurse ≠ μTax auditor ≠ μFast-food worker…In Jolie’s new Thai restaurant, she observes the age of her customers and notes down which of the groups they belong to – ’18 years old and below’ or ‘above 18 years old’, and whether they spent more than $30 on a single meal - ‘big spender’ or ‘non-big spender’. Given that rate (big spender | above 18 years old) > rate (big spender | 18 years old and below), what conclusion can be made? a) Being a big spender and being above 18 years old are negatively associated.b) Being a big spender and being above 18 years old are positively associated.c) Being above 18 years old is positively associated with visiting her restaurant.d) Being above 18 years old causes one to become a big spender.Under what circumstances is it advisable to switch to a between-subjects design instead of using a within-subjects design?
- If gender is the independent variable of a quasi-experiment, this experiment must have a between-subject design. Group of answer choices True FalseThe term “spotlight effect” refers to overestimating the extent to which others notice your appearance or behavior, especially when you commit a social faux pas. Effectively, you feel as if you are suddenly standing in a spotlight with everyone looking. In one demonstration of this phenomenon, Gilovich, Medvec, and Savitsky (2000) asked college students to put on a Barry Manilow T-shirt that fellow students had previously judged to be embarrassing. The participants were then led into a room in which other students were already participating in an experiment. After a few minutes, the participant was led back out of the room and was allowed to remove the shirt. Later, each participant was asked to estimate how many people in the room had noticed the shirt. The individuals who were in the room were also asked whether they noticed the shirt. In the study, the participants significantly overestimated the actual number of people who had noticed. In a similar study using a sample of n = 9…Based on a survey of 12,344 U.S. college students and 6,729 Canadian college students, Kuo, Adlaf, Lee, Gliksman, Demers, and Wechsler (2002) report that alcohol use is more common among Canadian than U.S. students, but heavy drinking (five or more drinks in a row for males, four or more for females) is significantly higher among U.S. students than Canadian students. Is this an example of a survey research design?
- A company institutes an exercise break for its workers to see if it will improve job satisfaction, as measured by a questionnaire that assesses workers' satisfaction before and after the implementation of the program. Using an appropriate nonparametric procedure and α=0.05, does the data indicate that that an exercise break for the workers improved job satisfaction? Worker Number 1 2 3 4 5 6 7 8 9 10Before 36 28 30 46 26 26 24 16 15 28After 33 36 49 41 36 40 39 21 20 37 1. Using the Normal approximation, find the value of the test statistic. 2 .Find the P-value for the test statistic. 3. Choose the correct conclusion below. A. The after exercise program job satisfaction scores are systematically higher when compared to the before exercise program job satisfaction scores. B. The after exercise program job satisfaction scores seem to be systematically equal when compared to the…Major league baseball did not have any black players until Jackie Robinson broke the color line in 1947, even though there was no doubt that black athletes had the requisite playing skills. Was this most likely to be indicative of employer, employee, consumer, or statistical discrimination?Do ethnic group and gender influence the type of care that a heart patient receives? The following pas- sage is from the article “Heart Care Reflects Race and Sex, Not Symptoms” (USA Today, February 25, 1999, reprinted with permission):Previous research suggested blacks and women were less likely than whites and men to get cardiac cathe- terization or coronary bypass surgery for chest pain or a heart attack. Scientists blamed differences in illness severity, insurance coverage, patient preference, and health care access. The researchers eliminated those differences by videotaping actors—two black men, two black women, two white men, and two white women—describing chest pain from identical scripts. They wore identical gowns, used identical gestures, and were taped from the same position. Researchers asked 720 primary care doctors at meetings of the American College of Physicians or the American Academy of Family Physicians to watch a tape and recommend care. The doctors thought the…