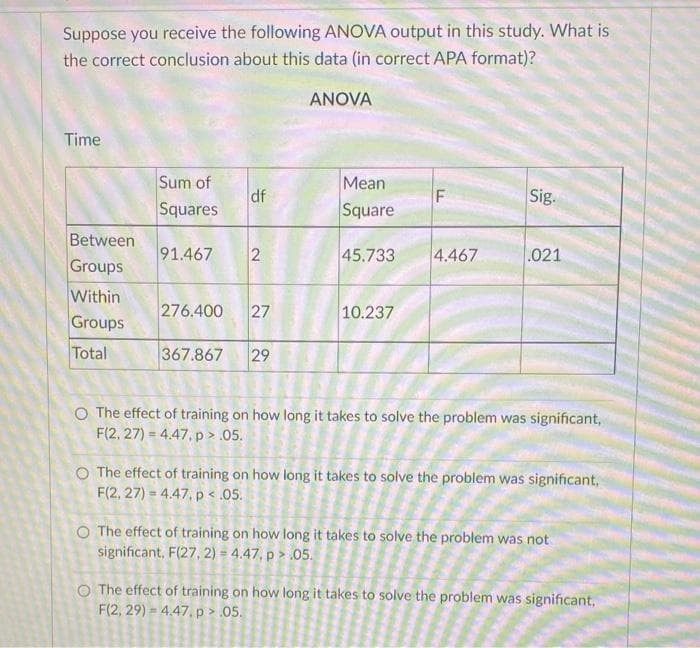
Suppose you receive the following ANOVA output in this study. What is the correct conclusion about this data (in correct APA format)?


Q: Would you expect the F-ratio of an independent-samples ANOVA using the same data to be the same,…
A: Introduction: Repeated measures ANOVA or repeated measures analysis of variance is a parametric…
Q: fifty-four wild bears were anesthetized, and then their weights and chest sizes were measured and…
A:
Q: When conducting a One-Way Analysis of variance, what option on the LSMEANS statement requests a…
A: Given information: The researcher is specially interested in conduction One-Way ANOVA.
Q: Analysis of Variance Source df SS MS F p Factor 3 36.14 12.05 8.37 0.002 Error 13 18.74 1.44…
A: The provided information is Source df SS MS F p Factor 3 36.14 12.05 8.37 0.002 Error 13…
Q: To determine if a training program has improved the average performance of trainees if data is…
A: Independent samples are known as the samples that are selected randomly so that the observations…
Q: To determine if the means of three or more populations are equal, you should use : Select one: O a.…
A:
Q: differentiate the following statistical terminologies with some examples. Population Parameter and…
A: Population parameter is a measure of the characteristics of the entire population whereas sample…
Q: What is the best correlational test to use in SPSS for a research sample size of 39?
A: A correlation coefficient is a value that shows how closely two sets of measurements are related. It…
Q: The alternative hypothesis for an ANOVA states that
A: ANOVA: In one factor ANOVA model only one factor is studied, that is only the effect on one factor…
Q: . May conducts a design of experiment and the following is the result of ANOVA analysis. The esult…
A: Given information: The results of ANOVA analysis for the design of experiment conducted by May is…
Q: Which of the following would decrease the value of the test statistic when dependent samples or…
A: Note: Since the options are not provided we have given the general answer. Please provide answer…
Q: A researcher is trying to determine if there is a significant relationship between age and annual…
A:
Q: When resampling data from two independent samples, what is the fundamental difference between…
A: Bootstrapping is basically a method of resampling a single dataset to generate a large number of…
Q: Given the results of the ANOVA (in the picture), which of the following is NOT correct?
A: Decision rule: If F-statistic is greater than F-crit, the null hypothesis is rejected. If…
Q: Is the Chebyshev's rule used only with populations? Are samples used as well?
A: Yes, Chebyshev’s rule can be applied to population as well as sample.We should know the following…
Q: Are these samples independent or paired?
A: When the two observations are taken on same individual then the samples are said to be paired.
Q: What is Two Related Samples?
A:
Q: Fifty-four wild bears were anesthetized, and then their weights and chest sizes were measured and…
A: Given : From the given output : r = 0.968882 Critical value is ± 0.2680855
Q: If remedial measure is applied to address the problem of multicollinearity in the model, do you…
A: Multicollinearity (MColl) exists when independent variables (IVs) are dependent on each other.
Q: A senior accounting major at Midsouth State University has Job offers from CPA . To explore the…
A: We have given ANOVA table and we have to find out if there is difference in 4 means
Q: In one-way ANOVA, identify a statistic that measures a. the variation among the sample means. b. the…
A: From the given information, In one-way ANOVA, the required statistics that measures the variation…
Q: Fifty-four wild bears were anesthetized, and then their weights and chest sizes were measured and…
A: ANSWER:- H0:Ρ=0 i.e their is no linear correlation between weights and chest…
Q: A senior accounting major at Midsouth State University has job offers from four CPA firms. To…
A: The following information has been provided: Analysis of Variance Source df SS MS F p Factor…
Q: Does the data from the sample support his claim at a significance level of 0.05?
A: It is given that Sample size n = 60 Sample mean M = 3012 Sample SD s = 112 Level of significance =…
Q: Which of the following is not affected by extreme value in the data? variance range median mean
A:
Q: 1. Consider the following table is an example of a possible dataset: Smoking Yes No Total Yes 20 10…
A:
Q: Use the same scales to construct boxplots for the pulse rates of males and females from the…
A: Procedure to obtain boxplot using Excel: Enter the data of Men's pulse rates in an excel sheet. Go…
Q: a. Use an ANOVA with a = .05 to determine whether there are significant differences in student judg-…
A: a. The give study shows the scores of judgements of the acceptability of cheating for the students…
Q: What test would be best to use if there was a statistical difference between brands in an…
A: ANOVA : - It is statistical technique to measure the difference in mean between more than 2 groups.…
Q: When doing an ANOVA, you observe large differences in means between groups. Within the ANOVA…
A: ANOVA: It is a statistical method for testing hypotheses regarding the mean difference among two or…
Q: 1. Why should you use ANOVA instead of several t tests to evaluate mean differences when an…
A: As per our guidelines, we are only allowed to answer 1 question per query. T-test and Analysis of…
Q: When conducting a One-Way Analysis of variance, what option on the LSMEANS statement requests a…
A: One way analysis of variance ( ANOVA ) compares the means of two or more independent groups in order…
Q: what is the difference between grouped and ungrouped data?
A: Data can be classified as grouped data and ungrouped data.
Q: What does a non-statistical evaluation of the graphs of data for the two-factor experiment suggests?
A:
Q: Determine whether a significant degree of rank correlation exists, using desired significance level.…
A: The hypothesis is, Null hypothesis: H0: There is no significant degrees of rank correlation exists.…
Q: In one-way ANOVA, the total variation in scores can be divided into two sources ___
A: In general, the total variation in scores can be divided into two sources. They are shown below:
Q: A SAMPLE SIZE OF 36 WAS DRAWN AND ITS MEAN WAS FOUND TO BE 80. TEST WHETHER THIS SAMPLE COULD HAVE…
A:
Q: Given all the information provided: Identify the correlation coefficient, r. r= _____ (round to…
A: Claim : There is a linear correlation between the weights of bears and their chest sizes…
Q: Fifty-four wild bears were anesthetized, and then their weights and chest sizes were measured and…
A: C. Yes, because the test statistic nothing falls between the critical values. So there is…
Q: Is this study experimental or observational? Justify.
A: In the study given , The people have been divided into groups to determine the effect of Vitamin E…
Q: An analysis of variance produces SSb = 40 and MSb = 20. In this analysis, how many treatment…
A: Let k be the number of treatments Given that SSb = Between sum of squares = 40 MSb = Between mean…
Q: Differentiate the three measures of central tendency: ungrouped data.
A: The three measures of central tendency are : 1) Mean 2) Median 3) Mode MEAN →The arithmetic mean is…
Q: Explain the circumstances under which we would need to pool the variance for an independent samples…
A: The pooled sample variance offers a higher precision estimate of the variance than the individual…
Q: Provide one sample problem of Analysis of Variance (ANOVA)
A: ANOVA or the Analysis of Variance, is the process of comparing more than two samples and their…
Q: When does Two Related Samples occur?
A: Definition: Related sample: Paird data is known as releated sample or coupling data also called…
Q: It states that there is significant difference between the observed and expected data.
A: Alternative Hypothesis
Q: Is there a relationship between one’s gender and whether one owns a dog, cat, or reptile? Use the…
A: Given the data of
Q: ifty-four wild bears were anesthetized, and then their weights and chest sizes were measured and…
A: The correlation coefficient is 0.955 (rounded to 3 decimal places).
14


Trending now
This is a popular solution!

Step by step
Solved in 2 steps

- Five samples of a ferrous-type substance were used to determine if there is a difference between a laboratory chemical analysis and an X-ray fluorescence analysis of the iron content. Each sample was split into two subsamples and the two types of analysis were applied, with the accompanying results. Assuming that the populations are normal, test at the 0.05 level of significance whether the two methods of analysis give, on the average, the same result. Determine the test statistic t=?Five samples of a ferrous-type substance were used to determine if there is a difference between a laboratory chemical analysis and an X-ray fluorescence analysis of the iron content. Each sample was split into two subsamples and the two types of analysis were applied, with the accompanying results. Assuming that the populations are normal, test at the 0.02 level of significance whether the two methods of analysis give, on the average, the same resultFive samples of a ferrous-type substance were used to determine if there is a difference between a laboratory chemical analysis and an X-ray fluorescence analysis of the iron content. Each sample was split into two subsamples and the two types of analysis were applied, with the accompanying results. Assuming that the populations are normal, test at the 0.10 level of significance whether the two methods of analysis give, on the average, the same result.
- NutritionResearchers compared protein intake among threegroups of postmenopausal women: (1) women eating astandard American diet (STD), (2) women eating a lactoovo-vegetarian diet (LAC), and (3) women eating a strictvegetarian diet (VEG). The mean ± 1 sd for protein intake(mg) is presented in Table 12.29. *12.1 Perform a statistical procedure to comparethe means of the three groups using the critical-valuemethod.*12.2 What is the p-value from the test performed inProblem 12.1? I just want 12.2 solved.NutritionResearchers compared protein intake among threegroups of postmenopausal women: (1) women eating astandard American diet (STD), (2) women eating a lactoovo-vegetarian diet (LAC), and (3) women eating a strictvegetarian diet (VEG). The mean ± 1 sd for protein intake(mg) is presented in Table 12.29.*12.1 Perform a statistical procedure to comparethe means of the three groups using the critical-valuemethod.You’re interested in knowing if a walking plus strength training exercise program results in a significantly greater increase in maxVo2 as compared to a walking only or a strength training only exercise program. Participants are randomly selected and then randomly assigned to one of three groups— walking plus strength training, walking only, or strength training only. After 6-months of exercise the participants are assessed. Which statistical analyses was used?