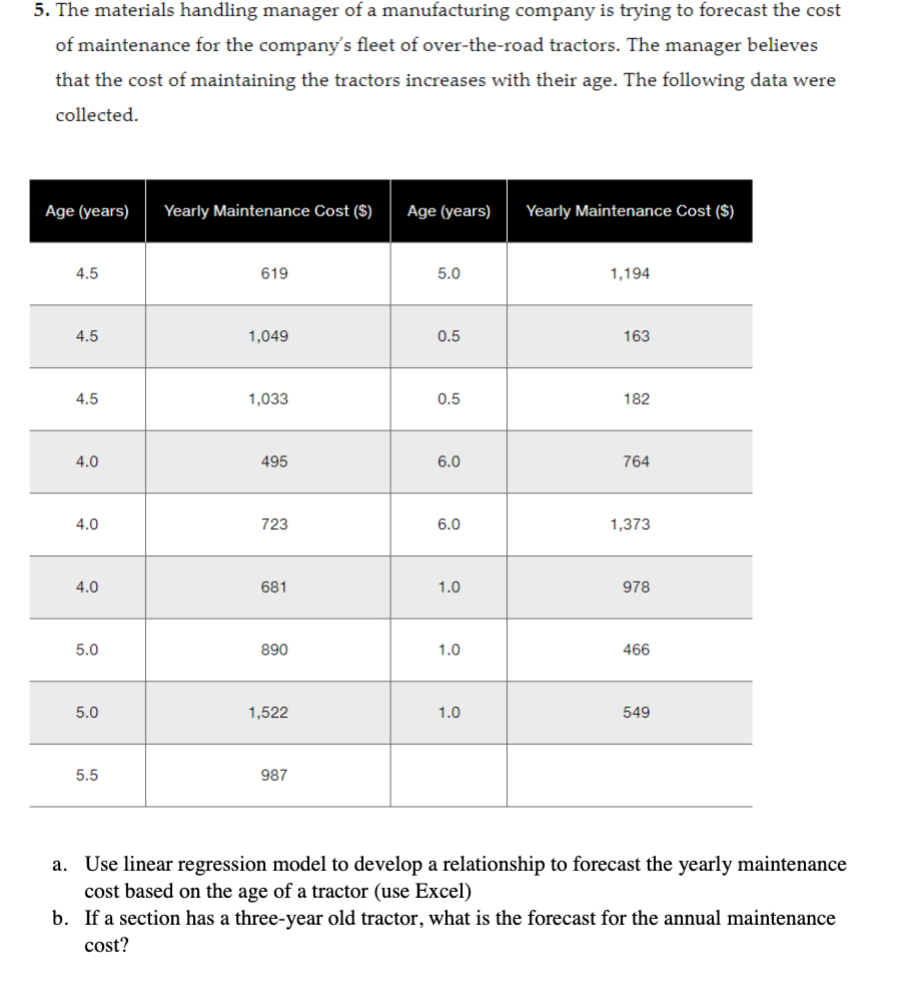
a. Use linear regression model to develop a relationship to forecast the yearly maintenance cost based on the age of a tractor (use Excel) b. If a section has a three-year old tractor, what is the forecast for the annual maintenance cost?


Q: (a) Draw a network with t, ES, EF, LS, and LF (follow the same format as Figure 11.5 on p.394).
A: As per Bartleby guidelines, we can only solve the first three subparts of one question at a…
Q: Munson Manufacturing, in Gainesville, Florida, wants to arrange its four work centers so as to…
A: Given data:
Q: A bagel store orders cream cheese from three suppliers, Cheesy Cream Corp. (CCC), Super Smooth &…
A: Assume Cheesy Cream Corp. (CCC) = A Super Smooth & Sons (SSS) = B Bagel's Best Friend Co. (BBF)…
Q: The table below contains data for the installation of new equipment in a manufacturing process at…
A: Indirect costs (per week) $12,000 Penalty cost (per week) beyond week 12 $6,000
Q: Operations management is a process that uses resources to transform inputs into outputs. Explain the…
A: Operations is a very important part of any business. It consists of all the activities related to…
Q: 12-2. What would efficient reverse management imply for the pricing of the Cowboys Stadium parking…
A: Reverse management refers to the processes involved in the recycling of items and their components…
Q: Note: This question requires Solver. Formulate the problem in Solver and find the optimal solution.…
A: The transportation model is used to calculate the minimum cost of the route by selecting different…
Q: The relative size of errors is shown by: Residuals O MSE O Bias O MAD O MAPE
A: Forecasting errors are common in a variety of industries. They are usually caused by human mistakes,…
Q: 11. DM Office Products (DMOP) is a wholesale supplier of office products with one facility in…
A: Formula used In Centroid Method: CX=∑dix × Vi∑Vi CY=∑diy× Vi∑Vi Where CX=X coordinate of centroidCy…
Q: The 4M company has a lathe as the centerpiece of the plant's work. The jobs arrive according to a…
A: Given data: Arrival rate (λ) = 2 per day Service rate (μ) = 4 per day Utilization λμ =24= 0.5
Q: Discuss solutions to high production Cost
A: A company that produces goods or merchandise is considered a manufacturer. Putting together various…
Q: Cesar Rego Computers, a Mississippi chain of computer hardware and software retail outlets, supplies…
A: Given, Annual demand D = 36100 disks Order cost S = $25 Holding cost = I * Purchase price =…
Q: A firm has prepared the following binary integer program to evaluate a number of potential locations…
A: Given data is Objective function: Max Z=15x1+25x2+15x3+35x4 Subject to constraints: 1.)…
Q: Discuss the six system aspects and or terminology of the MRP system
A: MRP Processes: MRP Stands for Material Requirement Planning. It is a computer-based…
Q: It takes an operator 1.60 minute to service a machine and 0.4 minute to walk to the next machine.…
A: Operator Time = 1.60 minutes Walking time = 0.4 minutes Machine run time = 6 minutes Operator earns…
Q: What is earned value management (EVM)? How is EVM used in project management?
A: Project management mainly refers to the set of particular expertise, skills, resources, &…
Q: Given the projected demands for the next six months, prepare an aggregate plan that uses inventory,…
A: Find the Calculation methods below: Output Forecast = (Regular Output - Forecast) + Overtime +…
Q: Formulate a chase sales and operations plan for a company with the following predicted demand: 1 2 3…
A: Chase plan means demand is met every period. This further means that there is no stockout and no…
Q: The Overton Hotel in Lubbock receives several complaints per year about their rooms. Over a 10-day…
A: The control chart depicts the development of a process through time. Graphs of the data are created…
Q: A contractor, Susan Meyer, has to haul gravel to three building sites. She can purchase as much as…
A: Objective functions and constraints: Objective functions: Minimize C = (100+300) X11…
Q: why do we need to determine the demographic profile of the customers of a resort business when…
A: "Since you have asked multiple questions, we will answer the first question for you. If you want any…
Q: Expected Time fot the critical path on a PERT network is 18.2 weeks, and the critical path variance…
A: Find the Calculation methods below: Probability = Projected time - Actual durationStandard…
Q: Rocky Mountain Tire Center sells 13,000 go-cart tires per year. The ordering cost for each order is…
A: Economic order quantity is the optimal quantity that company orders to fulfill the customers' demand…
Q: Doña Blanca plans to open a small car wash and must decide how much space to allocate to waiting…
A: The given question is based on finite queue variation of M/M/s model which is M/M/s/K where K…
Q: (i) (ii) (iii) (iv) The breakeven point for this situation Contribution margin Using a production…
A: The Break-even point is the point where total revenue and costs are the same. To calculate the…
Q: 12. Your company assembles five different models of a motor scooter that is sold in specialty stores…
A: The total cost of ownership refers to the total cost incurred in the procurement of the products,…
Q: William Beville's computer training school, in Richmond, stocks workbooks with the following…
A: For the workbooks, Demand = D = 19400 units per year Ordering Cost = $ 27 per order Holding Cost =…
Q: In the following MRP planning schedule for Item J. Indicate the correct net requirements, planned…
A: Find the Calculation methods below: Project on hand = Project on hand - Gross requirementsNet…
Q: Farihah is a project manager for a systems development project involving a new database application…
A: According to the case, For the human resources division of this company, Farihah is the project…
Q: Using the Center of Gravity method, near which map coordinates should the hub be located?
A: The center of gravity location method is a technique for locating the optimal location for a new…
Q: Design a transportation plan with minimum costs in piecekilometers (pkm) and calculate the…
A:
Q: Omega Manufacturing makes three products. Each product requires manufacturing oper- ations in three…
A: Integer linear programming is an optimization technique where the values of the decision variables…
Q: For the pressure of aerosol cans, the process mean is 78.24 and the process standard deviation is…
A: The process capability index (Cpk) refers to the arithmetical calculation to determine the closeness…
Q: Find the shortest-route distance from Chicago to node 6.
A: Operation management is performed in each manufacturing organization. It all deals with the…
Q: a) What is the economic order quantity? 306 units (round your response to the nearest whole number).…
A: Given Annual demand = 14100 Working days per year = 300 Lead time = 3
Q: 18hth must be at least 5 (the number TopLathes plus the number BigPresses must be a 5). All machines…
A: Linear programming is a mathematical technique that is also used in operations management…
Q: In an article in the April 2012 issue of the Newton Conservators newsletter you can read that In the…
A: Let the linear function be, y(x) = mx + c Given Initially i.e., at x = 0, there are 40000 trees and…
Q: Compute the demand per day for each month (round your responses to one decimal place). Production…
A: Forecasting is a technique used to predict future outcomes on the basis of past data. In business…
Q: Disscus the possbile causes of the following production waste 4.1.2 Overproduction waste
A: Overproduction waste is a type of waste that can happen in any organization. It is when the company…
Q: 2.28 A foundry produces castings to order. An order for 20 special castings has been re- ceived.…
A: x = the number of good units producedp(x) =probability of producing x good unitsQ = quantity of…
Q: Explain any two process technologies for materials
A: Process Technologies: Process technologies differ based on the nature of materials.…
Q: What is the earliest start (ES) and earliest finish (EF) times?
A: A network diagram related to the project shows the sequence of the task that is performed to…
Q: With activities B and C as immediate predecessors, the earliest start time for activity H must be…
A: Given: Duration of activity H (D) = 12 Early start time of activity H (ES) = 9
Q: The MRP gross requirements for Item X are shown here for the next 10 weeks. Lead time for A is two…
A: Find the Given details below: Week 1 2 3 4 5 6 7 8 9 10 Gross Requirements 20 10 15 45 10…
Q: Calculating the expected time and variance for all of these activities. -Drawing the full network…
A: A critical path can be described as a series of tasks that need to be completed in order for a…
Q: Calculate the Mean Absolute Percentage Error for the following data: Actual 91 86 87 97 Forecast…
A: Mean absolute percentage error is the difference between the actual and forecast and divided by…
Q: Briefly describethe bottom of the pyramid (BOP) process for developing business specifications.
A: The phrase "bottom of the pyramid" (BOP), sometimes known as "base of the pyramid," is used in…
Q: Wal Mart, although they are not a manufacturing company, uses sophisticated computer software to…
A: Inventory Control: In every business inventory management is very essential and…
Q: Using trend projection, develop a formula to predict sales for years 11 and 12. You have to show all…
A: Slope b=(n∑xy-∑x∑ y)/(n∑ x^2- (∑ x)^2) Intercept a=(∑ y-b∑ x)/n Equation y = a+bx Where y= TV sales…
Q: The university administration would like to add some additional parking locations. To make everyone…
A: With the given LPP, and the six variables, formulating in excel: Formulae: Solver constraints:


Trending now
This is a popular solution!

Step by step
Solved in 3 steps with 4 images

- The owner of a restaurant in Bloomington, Indiana, has recorded sales data for the past 19 years. He has also recorded data on potentially relevant variables. The data are listed in the file P13_17.xlsx. a. Estimate a simple regression equation involving annual sales (the dependent variable) and the size of the population residing within 10 miles of the restaurant (the explanatory variable). Interpret R-square for this regression. b. Add another explanatory variableannual advertising expendituresto the regression equation in part a. Estimate and interpret this expanded equation. How does the R-square value for this multiple regression equation compare to that of the simple regression equation estimated in part a? Explain any difference between the two R-square values. How can you use the adjusted R-squares for a comparison of the two equations? c. Add one more explanatory variable to the multiple regression equation estimated in part b. In particular, estimate and interpret the coefficients of a multiple regression equation that includes the previous years advertising expenditure. How does the inclusion of this third explanatory variable affect the R-square, compared to the corresponding values for the equation of part b? Explain any changes in this value. What does the adjusted R-square for the new equation tell you?Do the sales prices of houses in a given community vary systematically with their sizes (as measured in square feet)? Answer this question by estimating a simple regression equation where the sales price of the house is the dependent variable, and the size of the house is the explanatory variable. Use the sample data given in P13_06.xlsx. Interpret your estimated equation, the associated R-square value, and the associated standard error of estimate.The file P13_42.xlsx contains monthly data on consumer revolving credit (in millions of dollars) through credit unions. a. Use these data to forecast consumer revolving credit through credit unions for the next 12 months. Do it in two ways. First, fit an exponential trend to the series. Second, use Holts method with optimized smoothing constants. b. Which of these two methods appears to provide the best forecasts? Answer by comparing their MAPE values.
- The file P13_26.xlsx contains the monthly number of airline tickets sold by the CareFree Travel Agency. a. Create a time series chart of the data. Based on what you see, which of the exponential smoothing models do you think will provide the best forecasting model? Why? b. Use simple exponential smoothing to forecast these data, using a smoothing constant of 0.1. c. Repeat part b, but search for the smoothing constant that makes RMSE as small as possible. Does it make much of an improvement over the model in part b?A small computer chip manufacturer wants to forecast monthly ozperating costs as a function of the number of units produced during a month. The company has collected the 16 months of data in the file P13_34.xlsx. a. Determine an equation that can be used to predict monthly production costs from units produced. Are there any outliers? b. How could the regression line obtained in part a be used to determine whether the company was efficient or inefficient during any particular month?The file P13_02.xlsx contains five years of monthly data on sales (number of units sold) for a particular company. The company suspects that except for random noise, its sales are growing by a constant percentage each month and will continue to do so for at least the near future. a. Explain briefly whether the plot of the series visually supports the companys suspicion. b. By what percentage are sales increasing each month? c. What is the MAPE for the forecast model in part b? In words, what does it measure? Considering its magnitude, does the model seem to be doing a good job? d. In words, how does the model make forecasts for future months? Specifically, given the forecast value for the last month in the data set, what simple arithmetic could you use to obtain forecasts for the next few months?
- The file P13_29.xlsx contains monthly time series data for total U.S. retail sales of building materials (which includes retail sales of building materials, hardware and garden supply stores, and mobile home dealers). a. Is seasonality present in these data? If so, characterize the seasonality pattern. b. Use Winters method to forecast this series with smoothing constants = = 0.1 and = 0.3. Does the forecast series seem to track the seasonal pattern well? What are your forecasts for the next 12 months?Management of a home appliance store wants to understand the growth pattern of the monthly sales of a new technology device over the past two years. The managers have recorded the relevant data in the file P13_05.xlsx. Have the sales of this device been growing linearly over the past 24 months? By examining the results of a linear trend line, explain why or why not.The management of a technology company is trying to determine the variable that best explains the variation of employee salaries using a sample of 52 full-time employees; see the file P13_08.xlsx. Estimate simple linear regression equations to identify which of the following has the strongest linear relationship with annual salary: the employees gender, age, number of years of relevant work experience prior to employment at the company, number of years of employment at the company, or number of years of post secondary education. Provide support for your conclusion.
- The file P13_28.xlsx contains monthly retail sales of U.S. liquor stores. a. Is seasonality present in these data? If so, characterize the seasonality pattern. b. Use Winters method to forecast this series with smoothing constants = = 0.1 and = 0.3. Does the forecast series seem to track the seasonal pattern well? What are your forecasts for the next 12 months?Suppose that a regional express delivery service company wants to estimate the cost of shipping a package (Y) as a function of cargo type, where cargo type includes the following possibilities: fragile, semifragile, and durable. Costs for 15 randomly chosen packages of approximately the same weight and same distance shipped, but of different cargo types, are provided in the file P13_16.xlsx. a. Estimate a regression equation using the given sample data, and interpret the estimated regression coefficients. b. According to the estimated regression equation, which cargo type is the most costly to ship? Which cargo type is the least costly to ship? c. How well does the estimated equation fit the given sample data? How might the fit be improved? d. Given the estimated regression equation, predict the cost of shipping a package with semifragile cargo.A trucking company wants to predict the yearly maintenance expense (Y) for a truck using the number of miles driven during the year (X1) and the age of the truck (X2, in years) at the beginning of the year. The company has gathered the data given in the file P13_13.xlsx. Note that each observation corresponds to a particular truck. Estimate a multiple regression equation using the given data. Interpret each of the estimated regression coefficients. Also, interpret the standard error of estimate and the R-square value for these data.