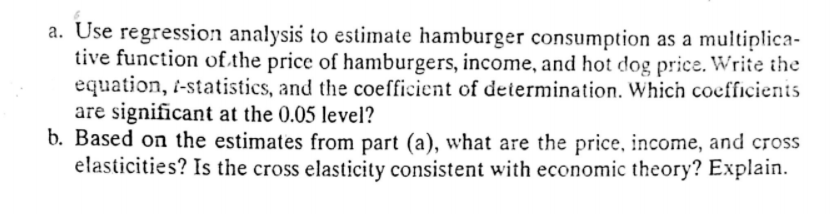
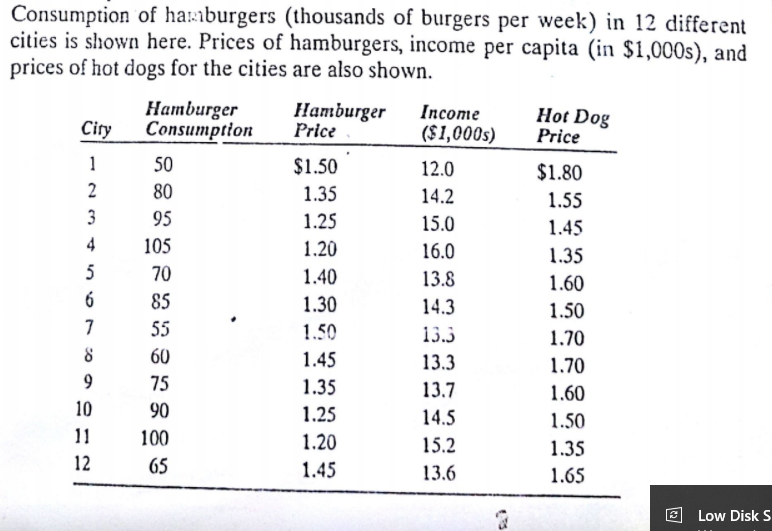
a. Use regression analysis to estimate hamburger consumption as a multiplica- tive function of.the price of hamburgers, income, and hot dog price. Write the equation, t-statistics, and the coefficient of deiermination. Which coefficienis are significant at the 0.05 level? b. Based on the estimates from part (a), what are the price, income, and cross elasticities? Is the cross elasticity consistent with economic theory? Explain.


Correlation
Correlation defines a relationship between two independent variables. It tells the degree to which variables move in relation to each other. When two sets of data are related to each other, there is a correlation between them.
Linear Correlation
A correlation is used to determine the relationships between numerical and categorical variables. In other words, it is an indicator of how things are connected to one another. The correlation analysis is the study of how variables are related.
Regression Analysis
Regression analysis is a statistical method in which it estimates the relationship between a dependent variable and one or more independent variable. In simple terms dependent variable is called as outcome variable and independent variable is called as predictors. Regression analysis is one of the methods to find the trends in data. The independent variable used in Regression analysis is named Predictor variable. It offers data of an associated dependent variable regarding a particular outcome.

Step by step
Solved in 2 steps with 1 images


