a. Use the computer regression output to write the equation of the least squares regression line. Be sure to define the variables. b. Interpret R-squared in the context of the problem. c. Interpret the slope in the context of the problem.


Unitary Method
The word “unitary” comes from the word “unit”, which means a single and complete entity. In this method, we find the value of a unit product from the given number of products, and then we solve for the other number of products.
Speed, Time, and Distance
Imagine you and 3 of your friends are planning to go to the playground at 6 in the evening. Your house is one mile away from the playground and one of your friends named Jim must start at 5 pm to reach the playground by walk. The other two friends are 3 miles away.
Profit and Loss
The amount earned or lost on the sale of one or more items is referred to as the profit or loss on that item.
Units and Measurements
Measurements and comparisons are the foundation of science and engineering. We, therefore, need rules that tell us how things are measured and compared. For these measurements and comparisons, we perform certain experiments, and we will need the experiments to set up the devices.
A, B, C have already been answered. I only need D and E answered, please!
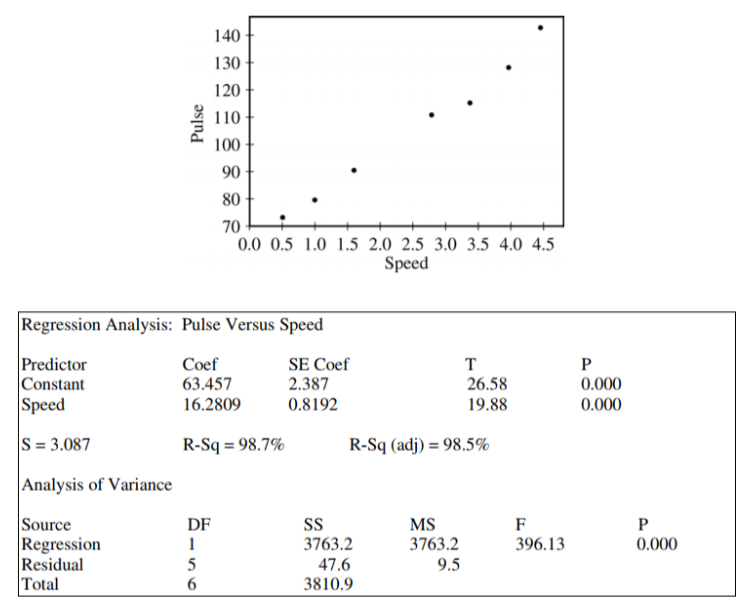
When Alan is walking his dog, he believes that as he increases his speed, his dog’s heart rate will increase. Since Alan took Statistics at High School and is now a veterinary medicine major at THE Ohio State University, he wants to model this relationship. Alan records his dog’s heart rate in beats per minute (bpm), while walking at each of 7 different speeds, in miles per hour (mph). A
a. Use the computer regression output to write the equation of the least squares regression line. Be sure to define the variables.
b. Interpret R-squared in the context of the problem.
c. Interpret the slope in the context of the problem.
d. Is there sufficient evidence to conclude that there is a relationship between speed and pulse? Explain.
e. Alan wants to provide a 98% confidence interval for the slope parameter in his report to his professor at THE Ohio State University. Compute the margin of error that Alan should use. Assume that conditions for inference are satisfied.


Trending now
This is a popular solution!

Step by step
Solved in 2 steps


