a. Use the data given to test the following hypotheses. (Round your answer to 2 decimal places, eg. 15.25) The value of the test statistic is and we b. Use the p-value to reach a statistical conclusion. (Round your answer to 4 decimal places, e.g. 0.1254)
a. Use the data given to test the following hypotheses. (Round your answer to 2 decimal places, eg. 15.25) The value of the test statistic is and we b. Use the p-value to reach a statistical conclusion. (Round your answer to 4 decimal places, e.g. 0.1254)

MATLAB: An Introduction with Applications
6th Edition
ISBN:9781119256830
Author:Amos Gilat
Publisher:Amos Gilat
Chapter1: Starting With Matlab
Section: Chapter Questions
Problem 1P

Related questions
Question
Subject : statestic
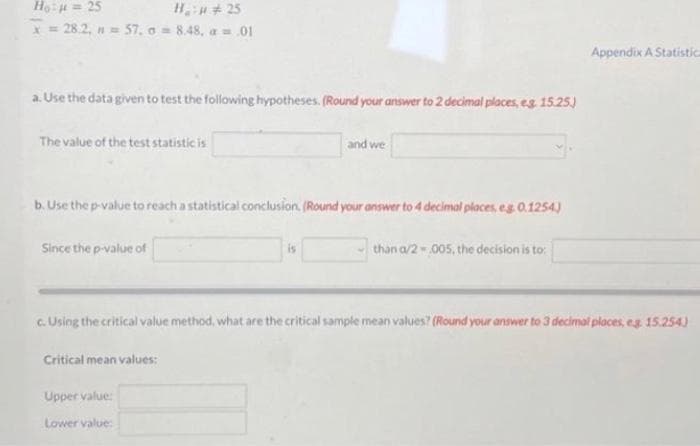
Transcribed Image Text:Ho: = 25
H₂H #25
x=28.2, n = 57, a = 8.48, a = .01
a. Use the data given to test the following hypotheses. (Round your answer to 2 decimal places, e.g. 15.25.)
The value of the test statistic is
b. Use the p-value to reach a statistical conclusion. (Round your answer to 4 decimal places, eg. 0.1254)
Since the p-value of
Critical mean values:
and we
is
Upper value:
Lower value:
than a/2005, the decision is to:
c. Using the critical value method, what are the critical sample mean values? (Round your answer to 3 decimal places, eg. 15.254)
Appendix A Statistica
Expert Solution
This question has been solved!
Explore an expertly crafted, step-by-step solution for a thorough understanding of key concepts.

Step by step
Solved in 3 steps with 2 images

Recommended textbooks for you
MATLAB: An Introduction with Applications
Statistics
ISBN:
9781119256830
Author:
Amos Gilat
Publisher:
John Wiley & Sons Inc

Probability and Statistics for Engineering and th…
Statistics
ISBN:
9781305251809
Author:
Jay L. Devore
Publisher:
Cengage Learning

Statistics for The Behavioral Sciences (MindTap C…
Statistics
ISBN:
9781305504912
Author:
Frederick J Gravetter, Larry B. Wallnau
Publisher:
Cengage Learning
MATLAB: An Introduction with Applications
Statistics
ISBN:
9781119256830
Author:
Amos Gilat
Publisher:
John Wiley & Sons Inc
Probability and Statistics for Engineering and th…
Statistics
ISBN:
9781305251809
Author:
Jay L. Devore
Publisher:
Cengage Learning
Statistics for The Behavioral Sciences (MindTap C…
Statistics
ISBN:
9781305504912
Author:
Frederick J Gravetter, Larry B. Wallnau
Publisher:
Cengage Learning

Elementary Statistics: Picturing the World (7th E…
Statistics
ISBN:
9780134683416
Author:
Ron Larson, Betsy Farber
Publisher:
PEARSON

The Basic Practice of Statistics
Statistics
ISBN:
9781319042578
Author:
David S. Moore, William I. Notz, Michael A. Fligner
Publisher:
W. H. Freeman

Introduction to the Practice of Statistics
Statistics
ISBN:
9781319013387
Author:
David S. Moore, George P. McCabe, Bruce A. Craig
Publisher:
W. H. Freeman