a. Using 2000 as the base year, compute the following statistics for each year: nominal GDP, real GDP, the implicit price deflator for GDP, and a fixed-weight price index such as the CPI.
a. Using 2000 as the base year, compute the following statistics for each year: nominal GDP, real GDP, the implicit price deflator for GDP, and a fixed-weight price index such as the CPI.

Principles of Economics 2e
2nd Edition
ISBN:9781947172364
Author:Steven A. Greenlaw; David Shapiro
Publisher:Steven A. Greenlaw; David Shapiro
Chapter1: Welcome To Economics!
Section: Chapter Questions
Problem 6SCQ: Suppose we extend the circular flow model to add imports and exports. Copy the circular flow diagram...

Related questions

Question
Answer #6
Transcribed Image Text:d. Def
f. Imports
поп
Do you see any stable relationships in the data?
Do you see any trends? (Hint: You can find the
data at www.bea.gov, which is the Web site of
the Bureau of Economic Analysis.)
com
does
year
e. Sup
ing
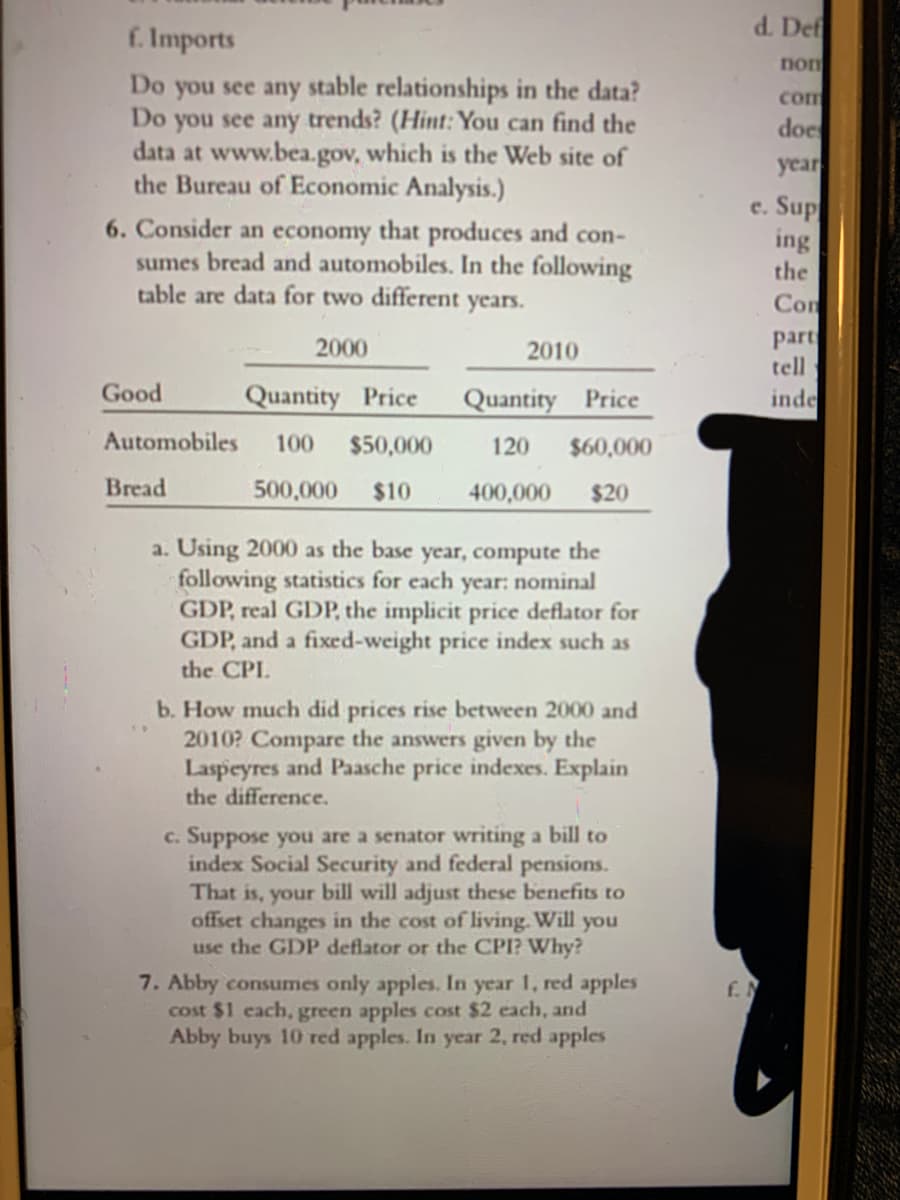
6. Consider an economy that produces and con-
sumes bread and automobiles. In the following
table are data for two different years.
the
Con
part
tell
2000
2010
Good
Quantity Price
Quantity Price
inde
Automobiles
100
$50,000
120
$60,000
Bread
500,000 $10
400,000
$20
a. Using 2000 as the base year, compute the
following statistics for each year: nominal
GDP, real GDP, the implicit price deflator for
GDP, and a fixed-weight price index such as
the CPI.
b. How much did prices rise between 2000 and
2010? Compare the answers given by the
Laspeyres and Paasche price indexes. Explain
the difference.
c. Suppose you are a senator writing a bill to
index Social Security and federal pensions.
That is, your bill will adjust these benefits to
offset changes in the cost of living. Will you
use the GDP deflator or the CPI? Why?
7. Abby consumes only apples. In year 1, red apples
cost $1 each,green apples cost $2 each, and
Abby buys 10 red apples. In year 2, red apples
f. N
Expert Solution
This question has been solved!
Explore an expertly crafted, step-by-step solution for a thorough understanding of key concepts.

This is a popular solution!

Trending now
This is a popular solution!

Step by step
Solved in 3 steps

Knowledge Booster


Learn more about
Need a deep-dive on the concept behind this application? Look no further. Learn more about this topic, economics and related others by exploring similar questions and additional content below.Recommended textbooks for you
Principles of Economics 2e
Economics
ISBN:
9781947172364
Author:
Steven A. Greenlaw; David Shapiro
Publisher:
OpenStax

Brief Principles of Macroeconomics (MindTap Cours…
Economics
ISBN:
9781337091985
Author:
N. Gregory Mankiw
Publisher:
Cengage Learning

Principles of Economics 2e
Economics
ISBN:
9781947172364
Author:
Steven A. Greenlaw; David Shapiro
Publisher:
OpenStax
Brief Principles of Macroeconomics (MindTap Cours…
Economics
ISBN:
9781337091985
Author:
N. Gregory Mankiw
Publisher:
Cengage Learning