GDP for 2010 in 2009's prices 3510 GDP for 2010 in 2010's prices $3924 Using 2009 as the base year, compute the percentage change in the price level, i.o. the inflation rate. hint: you need to compute the GDP deflator first. Using 2010 as the base year, compute the percentage change in the price level, i.e. the inflation rate. hint: you need to compute the GDP deflator first. The geometric average of the two inflation rates %
GDP for 2010 in 2009's prices 3510 GDP for 2010 in 2010's prices $3924 Using 2009 as the base year, compute the percentage change in the price level, i.o. the inflation rate. hint: you need to compute the GDP deflator first. Using 2010 as the base year, compute the percentage change in the price level, i.e. the inflation rate. hint: you need to compute the GDP deflator first. The geometric average of the two inflation rates %

Chapter6: Tracking The U.s. Economy
Section: Chapter Questions
Problem 4.8P

Related questions

Question
Can you please answer the last three questions. Thank you.
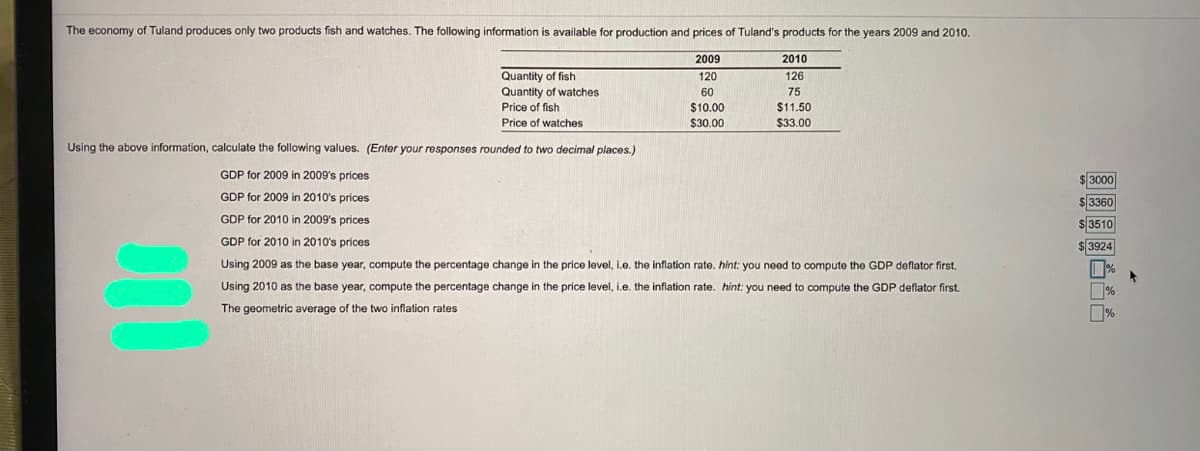
Transcribed Image Text:The economy of Tuland produces only two products fish and watches. The following information is available for production and prices of Tuland's products for the years 2009 and 2010.
2009
2010
Quantity of fish
120
126
Quantity of watches
Price of fish
60
75
$10.00
$11.50
Price of watches
$30.00
$33.00
Using the above information, calculate the following values. (Enter your responses rounded to two decimal places.)
GDP for 2009 in 2009's prices
$3000
GDP for 2009 in 2010's prices
$3360
GDP for 2010 in 2009's prices
$ 3510
$ 3924
GDP for 2010 in 2010's prices
Using 2009 as the base year, compute the percentage change in the price level, i.e. the inflation rate. hint: you need to compute the GDP deflator first.
Using 2010 as the base year, compute the percentage change in the price level, i.e. the inflation rate. hint: you need to compute the GDP deflator first.
D%
The geometric average of the two inflation rates
Expert Solution
This question has been solved!
Explore an expertly crafted, step-by-step solution for a thorough understanding of key concepts.

This is a popular solution!

Trending now
This is a popular solution!

Step by step
Solved in 3 steps with 3 images

Knowledge Booster


Learn more about
Need a deep-dive on the concept behind this application? Look no further. Learn more about this topic, economics and related others by exploring similar questions and additional content below.Recommended textbooks for you


Economics (MindTap Course List)
Economics
ISBN:
9781337617383
Author:
Roger A. Arnold
Publisher:
Cengage Learning

Economics: Private and Public Choice (MindTap Cou…
Economics
ISBN:
9781305506725
Author:
James D. Gwartney, Richard L. Stroup, Russell S. Sobel, David A. Macpherson
Publisher:
Cengage Learning