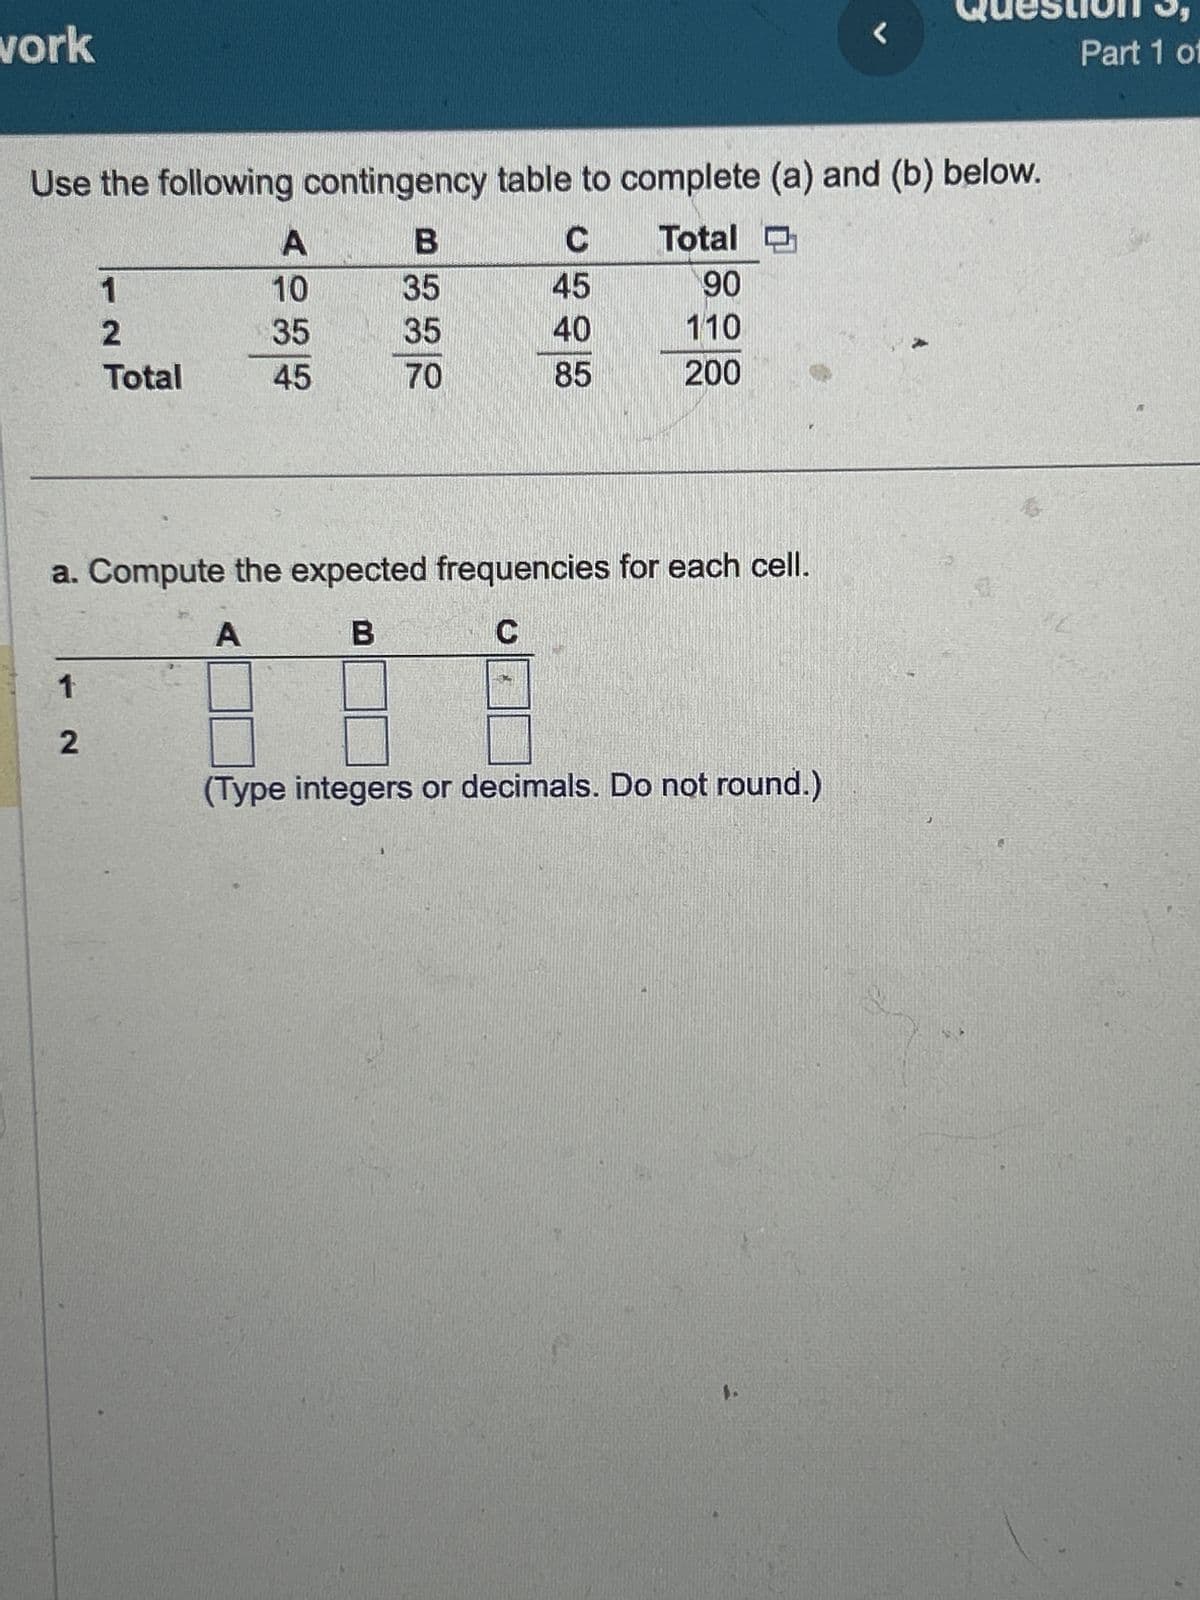
Use the following contingency B 35 35 70 1 2 Total 1 2 A 10 35 45 table to complete (a) and (b) below. Total 90 110 200 C 45 40 85 a. Compute the expected frequencies for each cell. A B C (Type integers or decimals. Do not round.)


Q: a. The range of values of the top 9% of the data. ZV b. The range of values of the middle 80% of the…
A: Random variable z from standard normal variates 1): value of z for the top 9% 2): range of values…
Q: 14) In a survey sponsored by Coca-Cola, subjects aged 15-65 were asked what contributes most to…
A: contribute to most happiness P(x) family 0.77 friends 0.15 work/study 0.08 leisure 0.08…
Q: Find a value of c so that P(Z ≤ c) = 0.65.
A: According to the given information in this question We need to find the value of c
Q: For a sample with a standard deviation of s = 12, a score of X = 42 corresponds to z = –0.50. The…
A: given data s = 12 x = 42 z = -0.50 sample mean (M) = ?
Q: te and interpret the coeffici 0.05 level of significance, is calories and sugar?
A: Given, Sample Calories (x) Sugar (y) Cereal 1 81 5 Cereal 2 100 3 Cereal 3 98 4 Cereal 4…
Q: What proportion of variance in husband height is predictable from wife height? What proportion of…
A: Given that rXY=0.32 The proportion of variance in husband height is predictable from wife height is,…
Q: How many different license plates can be made by using two letters followed by three digits selected…
A: The licensing plate should contain 5 places in which first 2 positions filled with letters and next…
Q: Imagine a population evolving by genetic drift, in which the frequency of allele K is 0.6. What is…
A: Given : the frequency of allele K is 0.6.
Q: Round the following answer to the nearest integer. The 55th percentile height in Ventura County is…
A: given data normal distribution μ = 53.7σ= 7.1here your answers of first two parts are correct so i…
Q: A sample score of n=9 is randomly selected from a population with a population mean of 50 and a…
A: GIVEN DATA,n=9μ=50σ=24M=80z score =? 80-
Q: b. Select a appropriate Pareto diagram for the above car repair shop data:
A: From the given information, Work Frequency Lube & oil 12 Brakes 7 Tires 6 Battery 4…
Q: Find the indicated probability. 43) The diameters of bolts produced by a certain machine are…
A: GivenMean(μ)=0.30standard deviation(σ)=0.01
Q: A bank with branches located in a commercial district of a city and in a residential area has the…
A: t stat = (mean1 - mean2)/√[(S1²/N1) + ( S2²/N2)] 1: commercial(N1=15)…
Q: Suppose that the probability of passing an exam is 60 percent, so the probability of failing the…
A: given data P(pass exam) = p =0.60 no. of trials = n = 5 x = no. of students pass exam P(x=X) =…
Q: Regression analysis was applied between sales data (y in $1000s) and advertising data (x in $100s)…
A: From the provided information, y^=12+1.8x And n = 17, SSR = 225, SSE = 75, Sb1 = 0.2683
Q: A sales manager for a large department store believes that customer spending per visit with a sale…
A: given Level of significance ɑ=0.01, df=328
Q: When she was 9 years of age, a girl did a science fair experiment in which she tested professional…
A: given data,n=247 trials x= 105α=0.10p^=xn=105247=0.4251here p=q=0.5
Q: 27) The probability that z lies between 0.7 and 1.98
A: GIVEN DATA standard normal distributionZ~N(0,1)find P(0.7<z<1.98) = ?
Q: 1) Let X₁, X2, X3, ... Xn be a sequence of independent and identically distributed with the…
A: As per our guidelines I can solve only first 3 subparts. Kindly post the remaining subpart again and…
Q: t is the importance of statistics in research?
A: Given that we have the importance of statistics in research
Q: a) The final grades of forty students were randomly selected, recorded and inputted into MINITAB.…
A: According to the given information in this question There are more than three subparts according to…
Q: Please DRAW a Venn Diagram on paper and solve the problem using the diagram. Insert a picture of…
A: given data n(total) = 45 n(yellow stone) = 27 n(yosemite) = 23 n(both yellow stone and yosemite) =…
Q: The Pasadena fire department aims to respond to fire calls in 8 minutes or less, on average.…
A: GIVEN DATA, normal distributionσ=1 minute 48 secound =1*60+48=108 secound n=18x¯=8 minute 49…
Q: Let's say the population mean (µ) is 20 with a standard deviation (\sigmaσ) of 1 for a particular…
A:
Q: Use the following information from a multiple regression analysis to complete parts (a) through (c)…
A:
Q: 1) Soda consumption is very common in the U.S. For the purposes of this question, assume that 30% of…
A:
Q: Find the following using the standard normal distribution table. Sketch the area under area…
A: Standard normal distribution is a special case of normal distribution.The standard normal variable…
Q: If the standard deviation of a sample is 9. How many subjects would we need to have 80% power to…
A: Given: Sample standard deviation s = 9 Difference d = 9 Significance level α = 0.025 Formula Used: n…
Q: If the population standard deviation is 9, then what is the variance? a. 9 b. 81 c. 3 d. 18
A: It is given that The population standard deviation is 9. We have to find the variance.
Q: Jamie and Margie need to divide a couch and a hot tub. Using the method of sealed bids, Jamie bids…
A:
Q: A particular fruit's weights are normally distributed with a mean of 598 grams and a standard…
A: Given mean= 598, standard deviations=34, n=4
Q: 6.9 When a production process is operating correctly, the number of units produced per hour has a…
A: Here, mean is 92 and standard deviation is 3.6. Sample is 4. We will sampling distribution to find…
Q: he mean SAT score in mathematics is 510. The standard deviation of these scores is 43. A special…
A: given data,n=60x¯=523α=0.05σ=43claim :μ>510one- tailed test
Q: For the following exercise where applicable: a. State the hypotheses and identify the claim. b.…
A: From the provided information, Sample size (n) = 80 From which 50% responded that they skipped…
Q: 66. Exposure to Background Television. CNN reports that young children in the United States are…
A:
Q: 25) Find the area of the indicated region under the standard normal curve. -1.13 O 2.03
A: Required probability is P(Z<-1.13 or Z>2.03)
Q: signment A Pew Research study conducted in 2017 found that approximately 75% of Americans believe…
A:
Q: Given data: population mean = 25, sample mean = 22, standard deviation = 9.4, sample size = 55,…
A: Given population mean = 25, sample mean = 22, standard deviation = 9.4, sample size = 55, level of…
Q: Let X = the time in hours between two successive arrivals at the drive-up window of a fast food…
A: Given X~exp(10)
Q: QUESTION 13 How many simple random samples of size 3 can be selected from a population of size 8? a.…
A: Given N=8, n=3 Farmula used r!=r(r-1)(r-2)×...×3×2×1
Q: The following information is available for two samples selected from independent normally…
A: Given: Population A Variance, s12=36 Sample Size, n1=30 Population B Variance, s22=25 Sample Size,…
Q: QUESTION 7 For a continuous random variable x, the height of the function at x is a. the probability…
A:
Q: To study the effect of temperature on yield in a chemical process, five batches were produced at…
A: Given F=0.25 , df1=10, df2=236
Q: Solve using R studio commands Suppose Z~N(0,1), find: (a) P(Z < 0.5), P(Z = 0.5), and P(Z ≥ 2.3)…
A: Solution: Let Z be the standard normal variable with mean 0 and standard deviation 1. Z~N(0,1)
Q: The proportion p of residents in a community who recycle has traditionally been 70%. A policy maker…
A: We have given that Sample size n =250 Favorable cases x =156 Sample proportion p^=x/n =156/250…
Q: Lost-time accidents occur in a company at a mean rate of 0.3 per day. What is the probability that…
A: To find: What is the probability that the number of lost time accidents 1g over a period of 9 days…
Q: Consider evidence from a random sample of 15 cars of the same model. The average gas mileage from…
A: given data assume normal distribution with σ = 5.2sample size (n) = 15sample mean (x¯) = 26.790% ci…
Q: 3) Find the standard deviation, o, for the binomial distribution which has the stated values of n…
A: given data n = 503 p = 0.7 binomial distribution standard deviation(σ) = ?
Q: Linear Regression Application, Interpolation and Extrapolation Jse the data and story to answer the…
A:
Q: For the image below, what would you input into the graphing calculator function to find the…
A: Answer: - Given, A standard normal curve Find P(Z > -0.92) = ?
Compute the expected frequencies for each cell
Compute X^2 STAT. Is it significant at a = 0.01?


Trending now
This is a popular solution!

Step by step
Solved in 4 steps with 3 images

- Ashton surveyed the students in his neighborhood and obtained the following contingency table that summarizes the school enrollment by level and type:Use the following contingency table to complete (a) and (b) below. A B C Total 1 15 25 50 90 2 40 50 60 150 Total 55 75 110 240 Question content area bottom Part 1 a. Compute the expected frequencies for each cell. A B C 1 enter your response here enter your response here enter your response here 2 enter your response here enter your response here enter your response here (Type integers or decimals. Do not round.) Part 2 b. Compute χ2STAT. Is it significant at α=0.005? Set up the null and alternative hypotheses to test. Choose the correct answer below. A. H0: π1=π2 H1: Not all πj are equal (where j=1,2) B.H0: Not all πj are equal (where j=A,B, C) H1: πA=πB=πC C.H0:Not all πj are equal (where…Please complete part 3. Use the following contingency table to complete (a) and (b) below. A B C Total 1 15 35 40 90 2 40 50 60 150 Total 55 85 100 240 Question content area bottom Part 1 a. Compute the expected frequencies for each cell. A B C 1 20.62520.625 31.87531.875 37.537.5 2 34.37534.375 53.12553.125 62.562.5 (Type integers or decimals. Do not round.) Part 2 b. Compute χ2STAT. Is it significant at α=0.005? Set up the null and alternative hypotheses to test. Choose the correct answer below. A.H0:πA=πB=πC H1:Not all πj are equal (where j=A,B, C) This is the correct answer. Part 3 Compute χ2STAT. χ2STAT= (Round to three decimal places as needed.)
- Use the contingency table to the right to complete parts (a) through (c) below. A B Total 1 55 15 70 2 15 40 55 Total 70 55 125 Question content area bottom Part 1 a. Find the expected frequency for each cell. A B Total 1 enter your response here enter your response here 70 2 enter your response here enter your response here 55 Total 70 55 125 (Type integers or decimals.) Part 2 b. Compare the observed and expected frequencies for each cell. Choose the correct answer below. A. The totals for the observed and expected frequencies are the same. B. The expected values are always greater than the observed values. C. The observed values are always greater than the expected values. D. The totals for the observed values are always greater than the totals for the expected values. Part 3. Compute χ2STAT.Is it significant at α=0.025? First let π Subscript 1 be the…A random sample of 76 statistics students were asked about their latest test score (pass or failand whether they studied for the test or not. The following contingency table gives the two-way classification of their responses .Amie Jackson, a manager at Sigma travel services, makes every effort to ensure that customers attempting to make online reservations do not have to wait too long to complete the reservation process. The travel website is open for reservations 24 hours a day, and Amie regularly checks the website for the waiting time to maintain consistency in service. She uses the following independently drawn samples of wait time during two peak hours, morning 8 a.m. to 10 a.m. and evening 7 p.m. to 9 p.m., for the analysis. Assume that wait times are normally distributed. Wait Time (in seconds) Morning hours 8 a.m. to 10 a.m. 97 101 115 107 129 98 96 132 118 104 123 128 95 127 112 Evening hours 7 p.m. to 9 p.m. 95 92 89 90 102 96 85 81 84 100 97 80 98 79 99 At the 10% significance level, which of the following is the correct conclusion? Do not reject H0. We conclude that the variance of wait time during morning peak hours differs from that during the evening peak hours. Reject H0. We…
- Amie Jackson, a manager at Sigma travel services, makes every effort to ensure that customers attempting to make online reservations do not have to wait too long to complete the reservation process. The travel website is open for reservations 24 hours a day, and Amie regularly checks the website for the waiting time to maintain consistency in service. She uses the following independently drawn samples of wait time during two peak hours, morning 8 a.m. to 10 a.m. and evening 7 p.m. to 9 p.m., for the analysis. Assume that wait times are normally distributed. Wait Time (in seconds) Morning hours 8 a.m. to 10 a.m. 97 101 115 107 129 98 96 132 118 104 123 128 95 127 112 Evening hours 7 p.m. to 9 p.m. 95 92 89 90 102 96 85 81 84 100 97 80 98 79 99 A 90% confidence interval is found to be [1.19, 7.36], where the morning is the first group and the evening is the second group. Which of the following is the correct conclusion? Multiple Choice We can conclude the…With effect size and power given, what is our n value(# of new enrollees)?A lecturer at WIN wanted to know if he can predict student’s quiz results by asking them tocomplete a simple survey. The result of the survey is found in the file: Assignment 2 sem22020data set 1. Quiz Results EQR Study Hrs Age Sex BBT MB MC AuHS LM 15 10 3 19 0 0 1 1 0 1 14 15 4 24 0 0 1 0 0 1 9 15 1 20 0 10 1 0 0 1 6 10 3 21 0 0 1 1 0 1 14 15 4 21 0 9 1 0 0 1 12 10 6 21 0 2 0 1 0 1 12 13 2 21 1 8 1 0 0 0 15 15 0 20 0 8 1 0 0 1 12 15 3 20 0 10 1 0 0 1 13 15 0.2 19 0 8 1 0 0 1 15 15 2 20 0 6 1 0 1 1 12 14 5 20 0 5 1 1 1 1 14 15 7 22 0 8 0 0 0 0 7 7 10 21 1 7 0 0 1 0 11 15 5 24 0 0 1 0 0 1 10 10 3 22 1 0 1 0 0 1 13 11 3 23 1 1 1 1 1 1 13 15 2 22 1 8 0 0 0 0 13 12 4 20 1 7 1 0 1 0 13 10 3 20 1 0 1 0 0 1 8 13 5 20 1 8 0 0 0 0 12 13 5 22 0 5 0 0 0 1 13 15 8 22 0 5 0 1 0 1 10 13 4 23 1 7 1 0 0 1 13 13 0.5 20 1 0 0 0 0 0 12 13 0.5 20 1 0 1 0 0 0 15 15 2 21 0 10 1 0 0 1 10 13 6 22 0 6 1 1 0 1 11 8 5 20 0 10 0 0 1 0 12 10 4 19 1…
- Based on a Pitney Bowes survey, assume that 42% of consumers are comfortable having dronesdeliver their purchases. Five consumers are randomly selected from the population that wassurveyed. d) Use the range rule of thumb to determine if 4 of the 5 consumers being comfortable withdrone deliveries is significantly high.The human resource manager at a car dealership wants to know if the ages of its employees are related to the department that they work in. Data was compiled and tabulated in a 2-way contingency table. The employees were classified according to their age and department. d) What is the assumption on which these calculations are based? e) What is relevance of the statement” No cells with expected counts less than 5.”f) Do the records suggest a relationship or independence between age anddepartment for the employees of this car dealership at the 5% significance level? Give reason(s) for your answer.A teacher from the College of Business Administration of Pacific University is using the Test-Retest Method to check the reliability of her examination. She administered the exam to his students during the 1st week of the semester. After 4 weeks of using an online teaching modality, she again administered the same exam. The achievement test results of 10 randomly selected students were tallied, as shown below. Scores Scores Student 1st Test 2nd Test 1 75 79 2 80 81 3 81 80 4 79 82 5 75 78 6 76 75 7 88 86 8 86 90 9 82 85 10 84 87 The coefficient of reliability of her examination will be determined after she measures the degree of relationship of the 1st and 2nd tests, using the Spearman Rank-Order Correlation Coefficient, rho, rs. What is the reliability of her examination? Show your complete solution. How reliable is her examination?


