A. What percentage of students in the sample had a GPA above 3.39? B. Sketch a box plot for this data, don’t worry about identifying fences/outliers. Indicate where each number in the five number summary is on the boxplot C. Calculate the upper fence for this data set D. An appropriate equation to describe the standard deviation of this dataset is X= 0.709 or u= 0.709 or s= 0.709. Or o= 0.709
A. What percentage of students in the sample had a GPA above 3.39? B. Sketch a box plot for this data, don’t worry about identifying fences/outliers. Indicate where each number in the five number summary is on the boxplot C. Calculate the upper fence for this data set D. An appropriate equation to describe the standard deviation of this dataset is X= 0.709 or u= 0.709 or s= 0.709. Or o= 0.709

Glencoe Algebra 1, Student Edition, 9780079039897, 0079039898, 2018
18th Edition
ISBN:9780079039897
Author:Carter
Publisher:Carter
Chapter10: Statistics
Section10.6: Summarizing Categorical Data
Problem 30PPS

Related questions
Question
A. What percentage of students in the sample had a GPA above 3.39?
B. Sketch a box plot for this data, don’t worry about identifying fences/outliers. Indicate where each number in the five number summary is on the boxplot
C. Calculate the upper fence for this data set
D. An appropriate equation to describe the standard deviation of this dataset is
X= 0.709 or u= 0.709 or s= 0.709. Or o= 0.709
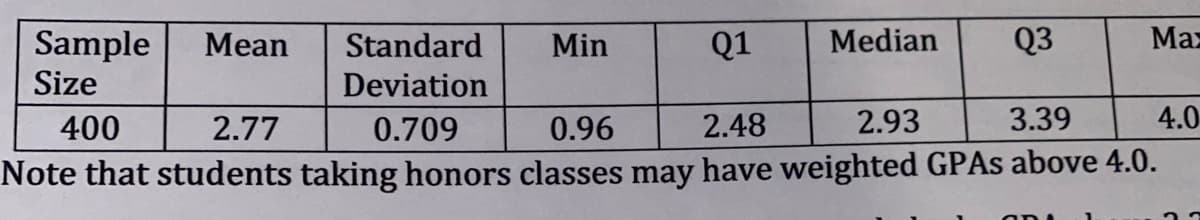
Transcribed Image Text:Median
Q3
Ma
Sample
Size
Mean
Standard
Min
Q1
Deviation
400
2.77
0.709
0.96
2.48
2.93
3.39
4.0
Note that students taking honors classes may have weighted GPAS above 4.0.
Expert Solution
This question has been solved!
Explore an expertly crafted, step-by-step solution for a thorough understanding of key concepts.

Step by step
Solved in 4 steps with 1 images

Recommended textbooks for you
Glencoe Algebra 1, Student Edition, 9780079039897…
Algebra
ISBN:
9780079039897
Author:
Carter
Publisher:
McGraw Hill
Glencoe Algebra 1, Student Edition, 9780079039897…
Algebra
ISBN:
9780079039897
Author:
Carter
Publisher:
McGraw Hill