a. What value should be assigned to the missing mean so that the resulting data would show no main effect for factor A? b. What value should be assigned to the missing mean so that the resulting data would show no main effect for factor B? c. What value should be assigned to the missing mean so that the data would show no interaction?
a. What value should be assigned to the missing mean so that the resulting data would show no main effect for factor A? b. What value should be assigned to the missing mean so that the resulting data would show no main effect for factor B? c. What value should be assigned to the missing mean so that the data would show no interaction?

Linear Algebra: A Modern Introduction
4th Edition
ISBN:9781285463247
Author:David Poole
Publisher:David Poole
Chapter2: Systems Of Linear Equations
Section2.4: Applications
Problem 2EQ: 2. Suppose that in Example 2.27, 400 units of food A, 500 units of B, and 600 units of C are placed...

Related questions
Topic Video
Question
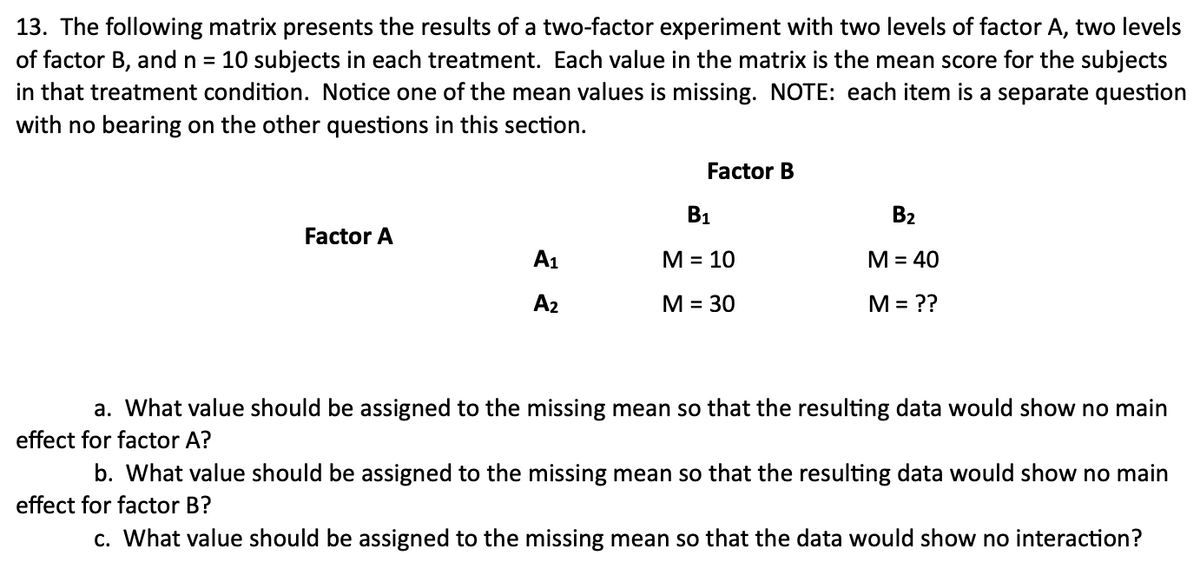
Transcribed Image Text:13. The following matrix presents the results of a two-factor experiment with two levels of factor A, two levels
of factor B, and n = 10 subjects in each treatment. Each value in the matrix is the mean score for the subjects
in that treatment condition. Notice one of the mean values is missing. NOTE: each item is a separate question
with no bearing on the other questions in this section.
Factor B
B1
B2
Factor A
A1
М- 10
M = 40
A2
M
= 30
M = ??
a. What value should be assigned to the missing mean so that the resulting data would show no main
effect for factor A?
b. What value should be assigned to the missing mean so that the resulting data would show no main
effect for factor B?
c. What value should be assigned to the missing mean so that the data would show no interaction?
Expert Solution
This question has been solved!
Explore an expertly crafted, step-by-step solution for a thorough understanding of key concepts.

This is a popular solution!

Trending now
This is a popular solution!

Step by step
Solved in 3 steps

Knowledge Booster


Learn more about
Need a deep-dive on the concept behind this application? Look no further. Learn more about this topic, statistics and related others by exploring similar questions and additional content below.Recommended textbooks for you
Linear Algebra: A Modern Introduction
Algebra
ISBN:
9781285463247
Author:
David Poole
Publisher:
Cengage Learning

Glencoe Algebra 1, Student Edition, 9780079039897…
Algebra
ISBN:
9780079039897
Author:
Carter
Publisher:
McGraw Hill
Linear Algebra: A Modern Introduction
Algebra
ISBN:
9781285463247
Author:
David Poole
Publisher:
Cengage Learning
Glencoe Algebra 1, Student Edition, 9780079039897…
Algebra
ISBN:
9780079039897
Author:
Carter
Publisher:
McGraw Hill