A1 88 1 2 3 4 5 6 7 لیا 8 5 household File Edit Y - 100% ▼ A W 4 30 XLSX .XLSX ✩ ☆ Edit View Insert Format Data View only C E Y A 80000 5000 74000 3000 8000 0 15000 0 45000 2000 60000 3000 65000 3000 1 2 45 fx | W B X 5 5 3 4 2 4 5 D Z 70000 60000 8000 15000 34000 45000 40000 Tools Help F G
A1 88 1 2 3 4 5 6 7 لیا 8 5 household File Edit Y - 100% ▼ A W 4 30 XLSX .XLSX ✩ ☆ Edit View Insert Format Data View only C E Y A 80000 5000 74000 3000 8000 0 15000 0 45000 2000 60000 3000 65000 3000 1 2 45 fx | W B X 5 5 3 4 2 4 5 D Z 70000 60000 8000 15000 34000 45000 40000 Tools Help F G

Big Ideas Math A Bridge To Success Algebra 1: Student Edition 2015
1st Edition
ISBN:9781680331141
Author:HOUGHTON MIFFLIN HARCOURT
Publisher:HOUGHTON MIFFLIN HARCOURT
Chapter4: Writing Linear Equations
Section: Chapter Questions
Problem 14CR

Related questions
Question
100%
- Set up the structural equations
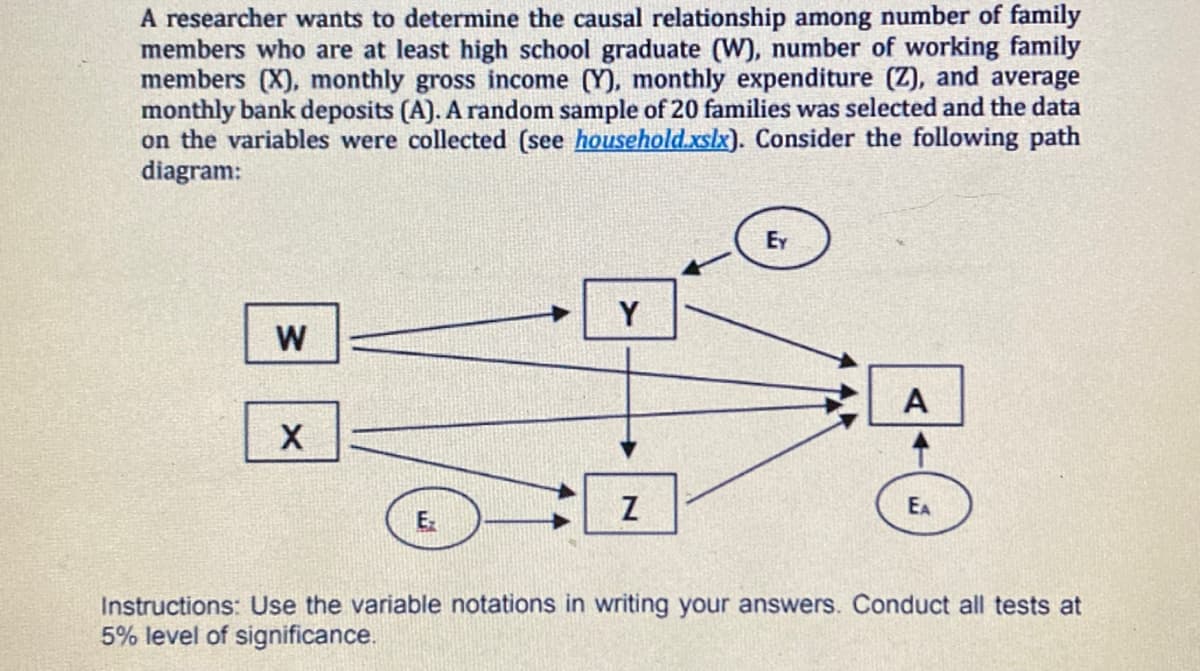
Transcribed Image Text:A researcher wants to determine the causal relationship among number of family
members who are at least high school graduate (W), number of working family
members (X), monthly gross income (Y), monthly expenditure (Z), and average
monthly bank deposits (A). A random sample of 20 families was selected and the data
on the variables were collected (see household.xslx). Consider the following path
diagram:
Ey
Y
W
A
X
Z
EA
E
Instructions: Use the variable notations in writing your answers. Conduct all tests at
5% level of significance.
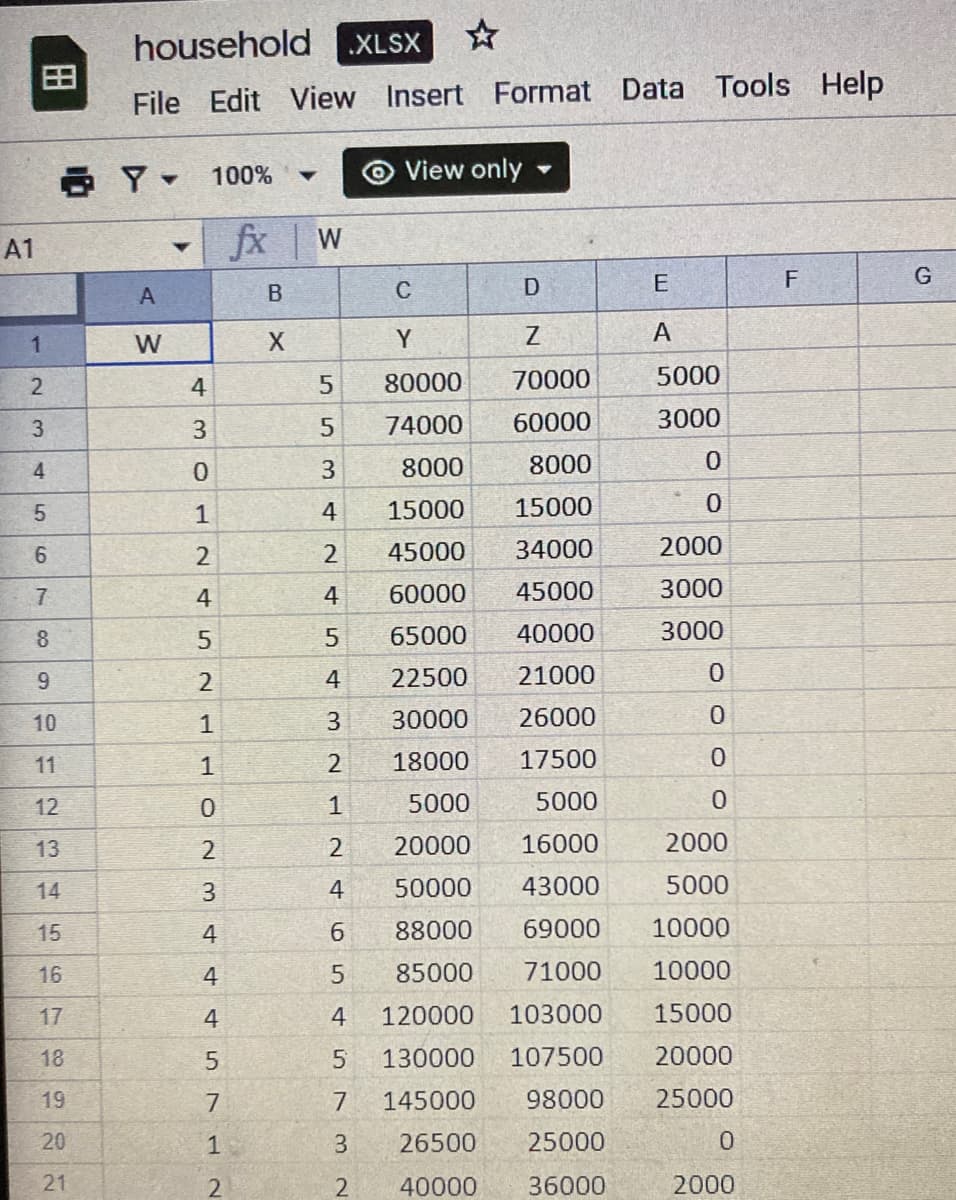
Transcribed Image Text:A1
88
1
2
3
4
5
6
7
8
9
10
11
12
13
14
15
16
11
17
18
19
20
21
household XLSX ✩
File Edit View Insert
Y 100%
▼
fx | W
A
B
W
X
4
3
O
1
2
4
5
2
1
1
0
2
3
st
4
st
4
4
5
7
1
2
View only
с
Y
80000
5
74000
3
8000
4
15000
2
45000
4 60000
5
65000
4
22500
3
30000
2 18000
1
5000
2
20000
4 50000
6
88000
5
85000
4
120000
5 130000
7 145000
3
26500
2
40000
5
Format Data
E
A
5000
3000
0
0
2000
3000
3000
0
0
0
0
2000
5000
10000
10000
15000
20000
25000
0
2000
D
Z
70000
60000
8000
15000
34000
45000
40000
21000
26000
17500
5000
16000
43000
69000
71000
103000
107500
98000
25000
36000
Tools Help
F
COLEC
G
Expert Solution
This question has been solved!
Explore an expertly crafted, step-by-step solution for a thorough understanding of key concepts.

Step by step
Solved in 2 steps with 2 images

Recommended textbooks for you
Big Ideas Math A Bridge To Success Algebra 1: Stu…
Algebra
ISBN:
9781680331141
Author:
HOUGHTON MIFFLIN HARCOURT
Publisher:
Houghton Mifflin Harcourt
Big Ideas Math A Bridge To Success Algebra 1: Stu…
Algebra
ISBN:
9781680331141
Author:
HOUGHTON MIFFLIN HARCOURT
Publisher:
Houghton Mifflin Harcourt