Above is the supply and demand graph in the market for coffee. The makers of tea, a substitute for coffee, lower their prices, and due to better weather, the price of coffee beans also decreases. Using the graph to answer the two questions to show the effects of these new events. Equilibrium price decreases Equilibrium quantity decreases
Above is the supply and demand graph in the market for coffee. The makers of tea, a substitute for coffee, lower their prices, and due to better weather, the price of coffee beans also decreases. Using the graph to answer the two questions to show the effects of these new events. Equilibrium price decreases Equilibrium quantity decreases

Chapter1: Introducing The Economic Way Of Thinking
Section1.A: Applying Graphs To Economics
Problem 2SQP

Related questions
Question
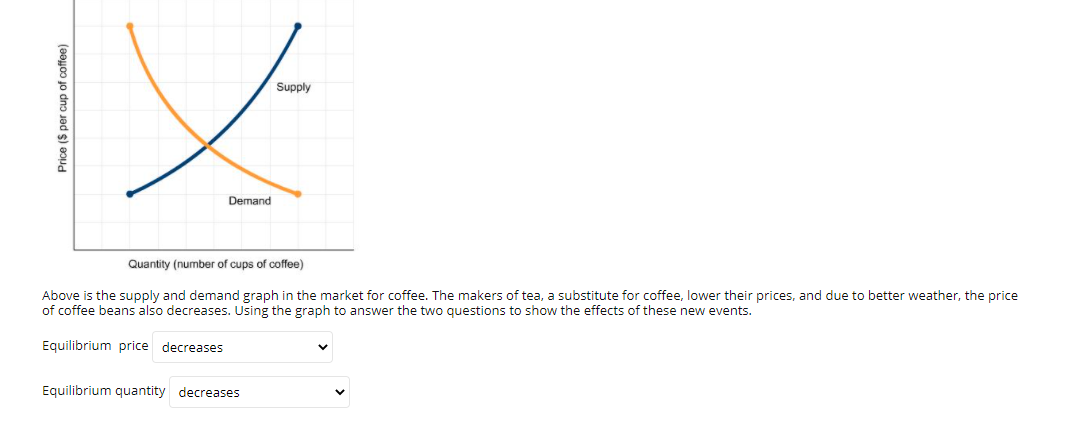
Transcribed Image Text:Supply
Demand
Quantity (number of cups of coffee)
Above is the supply and demand graph in the market for coffee. The makers of tea, a substitute for coffee, lower their prices, and due to better weather, the price
of coffee beans also decreases. Using the graph to answer the two questions to show the effects of these new events.
Equilibrium price decreases
Equilibrium quantity decreases
Price ($ per cup of coffee)
Expert Solution
This question has been solved!
Explore an expertly crafted, step-by-step solution for a thorough understanding of key concepts.

This is a popular solution!

Trending now
This is a popular solution!

Step by step
Solved in 2 steps with 1 images

Knowledge Booster


Learn more about
Need a deep-dive on the concept behind this application? Look no further. Learn more about this topic, economics and related others by exploring similar questions and additional content below.Recommended textbooks for you


Economics (MindTap Course List)
Economics
ISBN:
9781337617383
Author:
Roger A. Arnold
Publisher:
Cengage Learning
