On the following graph, plot the demand for shoes using the blue point (circle symbol). Next, plot the supply of shoes using the orange point (s symbol). Finally, use the black point (plus symbol) to indicate the equilibrium price and quantity in the market for shoes. Note: Plot your points in the order in which you would like them connected. Line segments will connect the points automatically. 120 100 Demand ロ 80 Supply Equilibrium P RICE (Dollars per pair of shoes)
On the following graph, plot the demand for shoes using the blue point (circle symbol). Next, plot the supply of shoes using the orange point (s symbol). Finally, use the black point (plus symbol) to indicate the equilibrium price and quantity in the market for shoes. Note: Plot your points in the order in which you would like them connected. Line segments will connect the points automatically. 120 100 Demand ロ 80 Supply Equilibrium P RICE (Dollars per pair of shoes)

Brief Principles of Macroeconomics (MindTap Course List)
8th Edition
ISBN:9781337091985
Author:N. Gregory Mankiw
Publisher:N. Gregory Mankiw
Chapter4: The Market Forces Of Supply And Demand
Section: Chapter Questions
Problem 8PA

Related questions
Question
Please make it as clear as possible this is my third time having to send this question :(
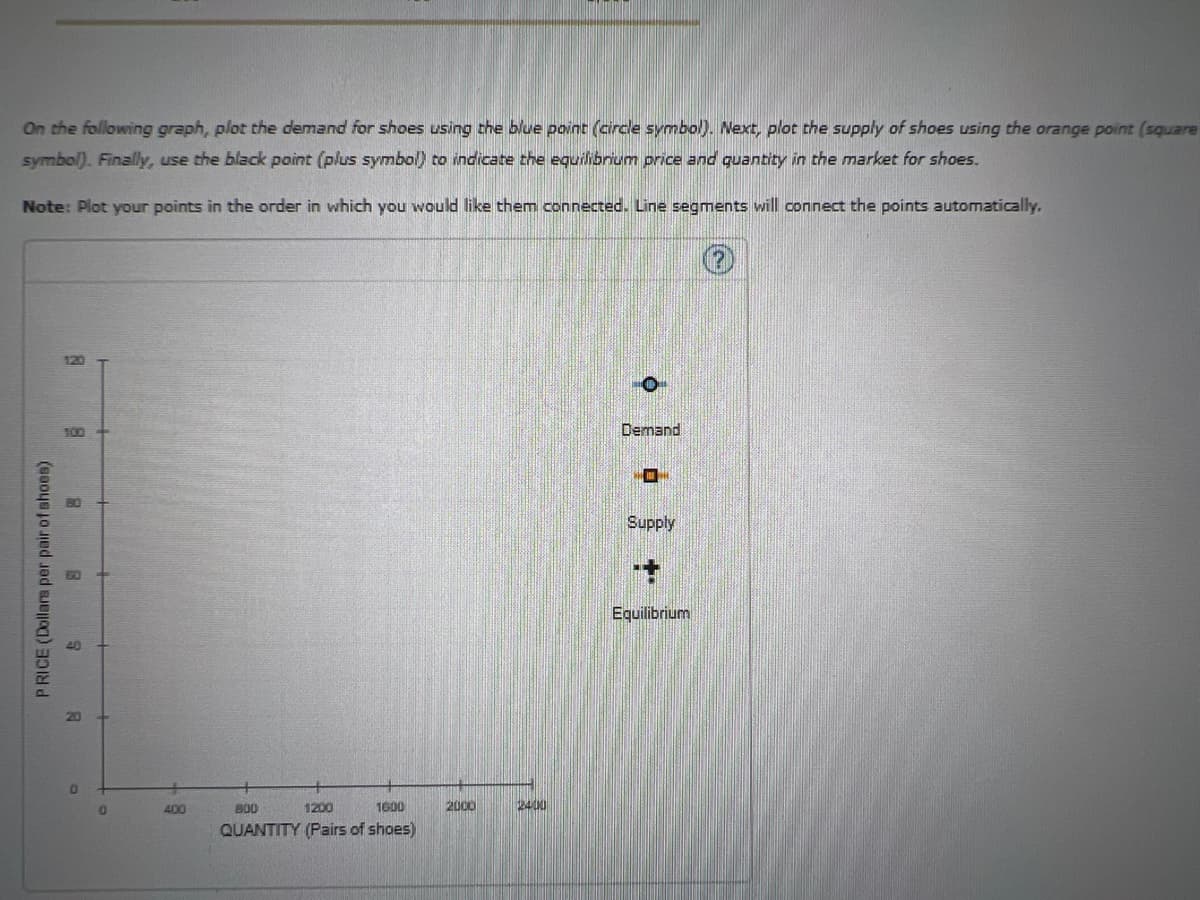
Transcribed Image Text:On the following graph, plot the demand for shoes using the blue point (circle symbol). Next, plot the supply of shoes using the orange point (square
symbol). Finally, use the black paint (plus symbol) to indicate the equilibrium price and quantity in the market for shoes.
Note: Plot your points in the order in which you would like them connected. Line segments will connect the points automatically.
120
100
Demand
Supply
Equilibrium
400
800
1200
1600
2000
2400
QUANTITY (Pairs of shoes)
P RICE (Dollars per pair of shoes)
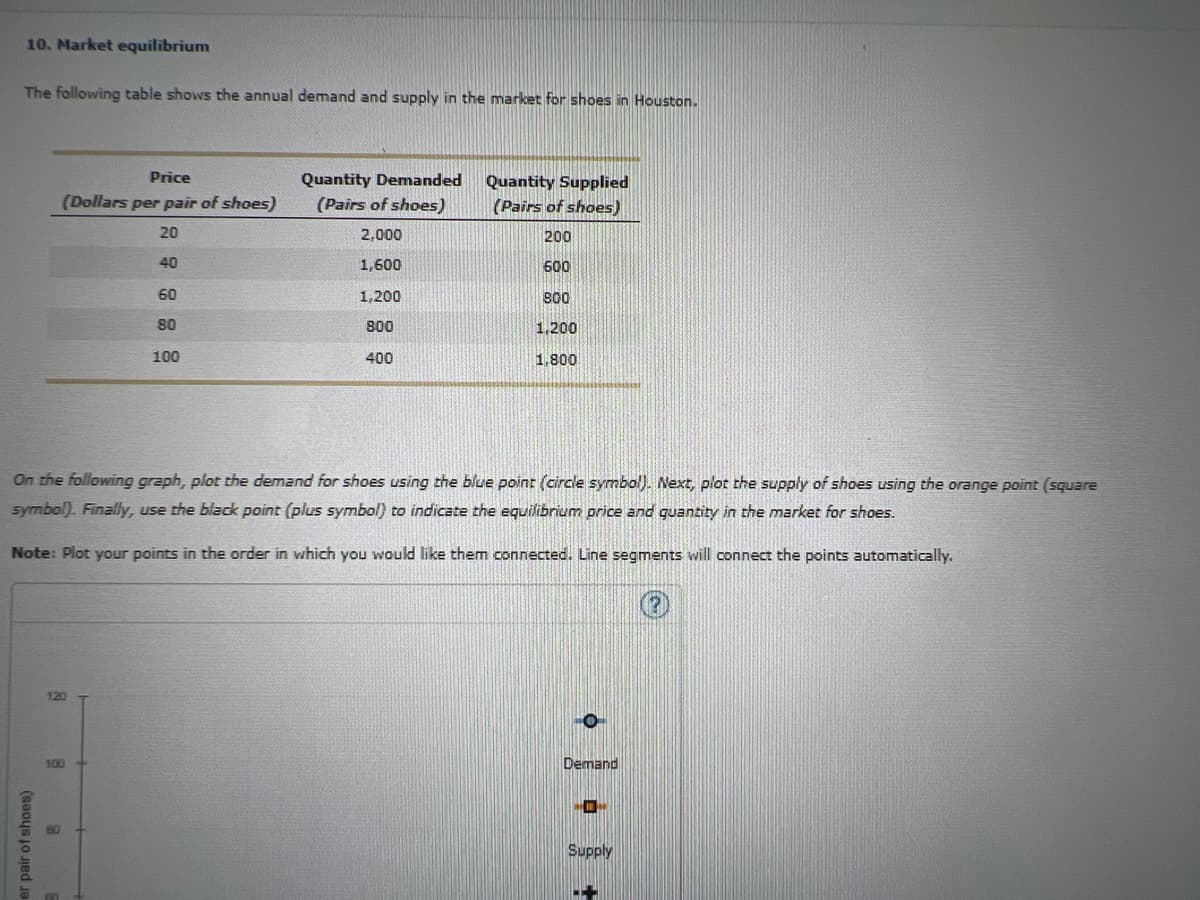
Transcribed Image Text:10. Market equilibrium
The following table shows the annual demand and supply in the market for shoes in Houston.
Price
Quantity Supplied
(Pairs of shoes)
Quantity Demanded
(Dollars per pair of shoes)
(Pairs of shoes)
20
2,000
200
40
1,600
600
60
1,200
80
80
800
1,200
100
400
1,800
On the following graph, plot the demand for shoes using the blue point (circle symbol). Next, plot the supply of shoes using the orange point (square
symbol). Finally, use the black point (plus symbol) to indicate the equilibrium price and guantity in the market for shoes.
Note: Plot your points in the order in which you would like them connected. Line segments will connect the points automatically.
120
100
Demand
Supply
er pair of shoes)
Expert Solution
This question has been solved!
Explore an expertly crafted, step-by-step solution for a thorough understanding of key concepts.

This is a popular solution!

Trending now
This is a popular solution!

Step by step
Solved in 2 steps with 1 images

Knowledge Booster


Learn more about
Need a deep-dive on the concept behind this application? Look no further. Learn more about this topic, economics and related others by exploring similar questions and additional content below.Recommended textbooks for you
Brief Principles of Macroeconomics (MindTap Cours…
Economics
ISBN:
9781337091985
Author:
N. Gregory Mankiw
Publisher:
Cengage Learning


Essentials of Economics (MindTap Course List)
Economics
ISBN:
9781337091992
Author:
N. Gregory Mankiw
Publisher:
Cengage Learning
Brief Principles of Macroeconomics (MindTap Cours…
Economics
ISBN:
9781337091985
Author:
N. Gregory Mankiw
Publisher:
Cengage Learning
Essentials of Economics (MindTap Course List)
Economics
ISBN:
9781337091992
Author:
N. Gregory Mankiw
Publisher:
Cengage Learning

Exploring Economics
Economics
ISBN:
9781544336329
Author:
Robert L. Sexton
Publisher:
SAGE Publications, Inc

Principles of Microeconomics
Economics
ISBN:
9781305156050
Author:
N. Gregory Mankiw
Publisher:
Cengage Learning
