According to a report an average person watched 4.55 hours of television per day in 2005. A random sample of 20 people gave the following number of hours of television watched per day for last year. At the 10% significance level, do the data provide sufficient evidence to conclude that the amount of television watched per day last year by the average person differed from that in 2005? d. identify the claim and state and e. find the critical value(s) and identify the rejection region(s),
According to a report an average person watched 4.55 hours of television per day in 2005. A random sample of 20 people gave the following number of hours of television watched per day for last year. At the 10% significance level, do the data provide sufficient evidence to conclude that the amount of television watched per day last year by the average person differed from that in 2005? d. identify the claim and state and e. find the critical value(s) and identify the rejection region(s),

Glencoe Algebra 1, Student Edition, 9780079039897, 0079039898, 2018
18th Edition
ISBN:9780079039897
Author:Carter
Publisher:Carter
Chapter10: Statistics
Section10.3: Measures Of Spread
Problem 1GP

Related questions

Topic Video
Question
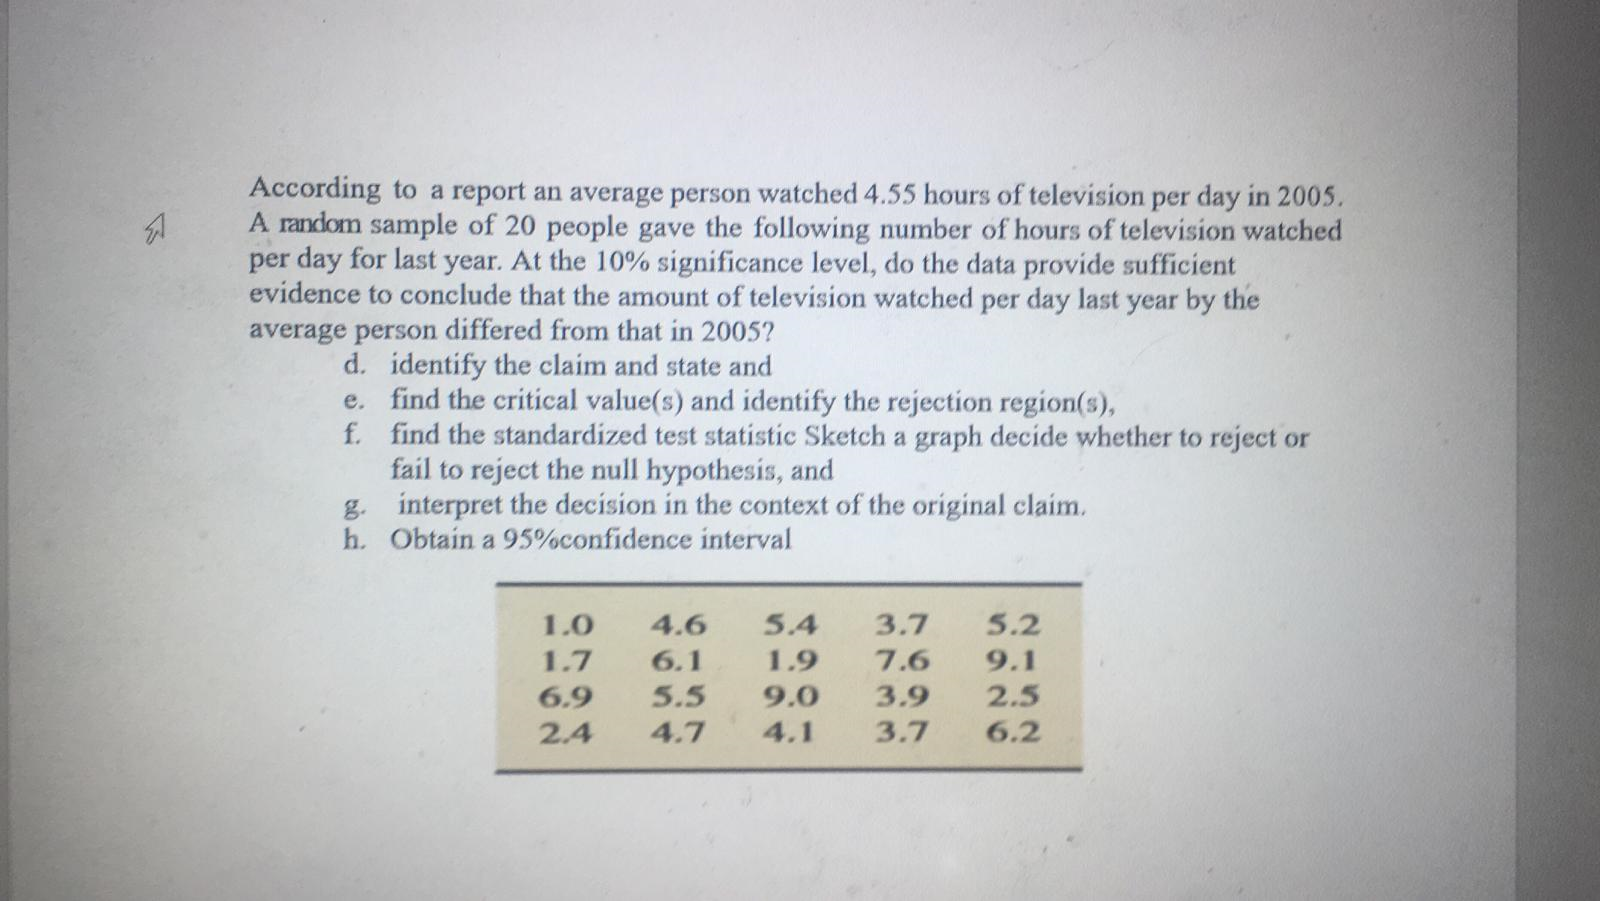
Transcribed Image Text:According to a report an average person watched 4.55 hours of television per day in 2005.
A random sample of 20 people gave the following number of hours of television watched
per day for last year. At the 10% significance level, do the data provide sufficient
evidence to conclude that the amount of television watched per day last year by the
average person differed from that in 2005?
d. identify the claim and state and
e. find the critical value(s) and identify the rejection region(s),
Expert Solution
This question has been solved!
Explore an expertly crafted, step-by-step solution for a thorough understanding of key concepts.

This is a popular solution!

Trending now
This is a popular solution!

Step by step
Solved in 3 steps with 4 images

Knowledge Booster


Learn more about
Need a deep-dive on the concept behind this application? Look no further. Learn more about this topic, statistics and related others by exploring similar questions and additional content below.Recommended textbooks for you
Glencoe Algebra 1, Student Edition, 9780079039897…
Algebra
ISBN:
9780079039897
Author:
Carter
Publisher:
McGraw Hill
Glencoe Algebra 1, Student Edition, 9780079039897…
Algebra
ISBN:
9780079039897
Author:
Carter
Publisher:
McGraw Hill