According to a report published last year by Pew Research, 23% of all American adults lived in a middle- class household. This year, an economist collected data from a random sample of 1345 American adults in order to determine if the percent of American adults who live in a middle-class household is lower than 23%. State the hypotheses and explain the possible Type 1 and Type 2 errors. Determine the null and alternative hypotheses: Ho: ? v? v HA: ? ? v A Type I error in the context of this problem would be: Select an answer Select an answer Rejecting that the percent of all American adults that live in a middle-class household is 23% when the percent is really 23%. Rejecting that the percent of all American adults that live in a middle-class household is 23% when the percent is really lower than that Rejecting that the percent of all American adults that live in a middle-class household is 23% when the percent is really higher than that. Rejecting that the percent of all American adults that live in a middle-class household is 23% when the percent is really different from that. Rejecting that the percent of all American adults that live in a middle-class household is lower than 23% when the percent is really 23%. Rejecting that the percent of all American adults that live in a middle-class household is higher than 23% when the percent is really 23%. Rejecting that the percent of all American adults that live in a middle-class household is different from 23% when the percent is really 23%. Failing to reject that the percent of all American adults that live in a middle-class household is 23% when the percent is really 23%. Failing to reject that the percent of all American adults that live in a middle-class household is 23% when the percent is really lower than that Failing to reject that the percent of all American adults that live in a middle-class household is 23% when the percent is really higher than that. Failing to reject that the percent of all American adults that live in a middle-class household is 23% when the percent is really different from that. Failing to reject that the percent of all American adults that live in a middle-class household is lower than 23% when the percent is really 23%. Failing to reject that the percent of all American adults that live in a middle-class household is higher than 23% when the percent is really 23%. Failing to reject that the percent of all American adults that live in a middle-class household is different from 23% when the percent is really 23%.
According to a report published last year by Pew Research, 23% of all American adults lived in a middle- class household. This year, an economist collected data from a random sample of 1345 American adults in order to determine if the percent of American adults who live in a middle-class household is lower than 23%. State the hypotheses and explain the possible Type 1 and Type 2 errors. Determine the null and alternative hypotheses: Ho: ? v? v HA: ? ? v A Type I error in the context of this problem would be: Select an answer Select an answer Rejecting that the percent of all American adults that live in a middle-class household is 23% when the percent is really 23%. Rejecting that the percent of all American adults that live in a middle-class household is 23% when the percent is really lower than that Rejecting that the percent of all American adults that live in a middle-class household is 23% when the percent is really higher than that. Rejecting that the percent of all American adults that live in a middle-class household is 23% when the percent is really different from that. Rejecting that the percent of all American adults that live in a middle-class household is lower than 23% when the percent is really 23%. Rejecting that the percent of all American adults that live in a middle-class household is higher than 23% when the percent is really 23%. Rejecting that the percent of all American adults that live in a middle-class household is different from 23% when the percent is really 23%. Failing to reject that the percent of all American adults that live in a middle-class household is 23% when the percent is really 23%. Failing to reject that the percent of all American adults that live in a middle-class household is 23% when the percent is really lower than that Failing to reject that the percent of all American adults that live in a middle-class household is 23% when the percent is really higher than that. Failing to reject that the percent of all American adults that live in a middle-class household is 23% when the percent is really different from that. Failing to reject that the percent of all American adults that live in a middle-class household is lower than 23% when the percent is really 23%. Failing to reject that the percent of all American adults that live in a middle-class household is higher than 23% when the percent is really 23%. Failing to reject that the percent of all American adults that live in a middle-class household is different from 23% when the percent is really 23%.

College Algebra (MindTap Course List)
12th Edition
ISBN:9781305652231
Author:R. David Gustafson, Jeff Hughes
Publisher:R. David Gustafson, Jeff Hughes
Chapter8: Sequences, Series, And Probability
Section8.7: Probability
Problem 58E: What is meant by the sample space of an experiment?

Related questions
Question
#11). Both pictures are the same question. Need help with it.
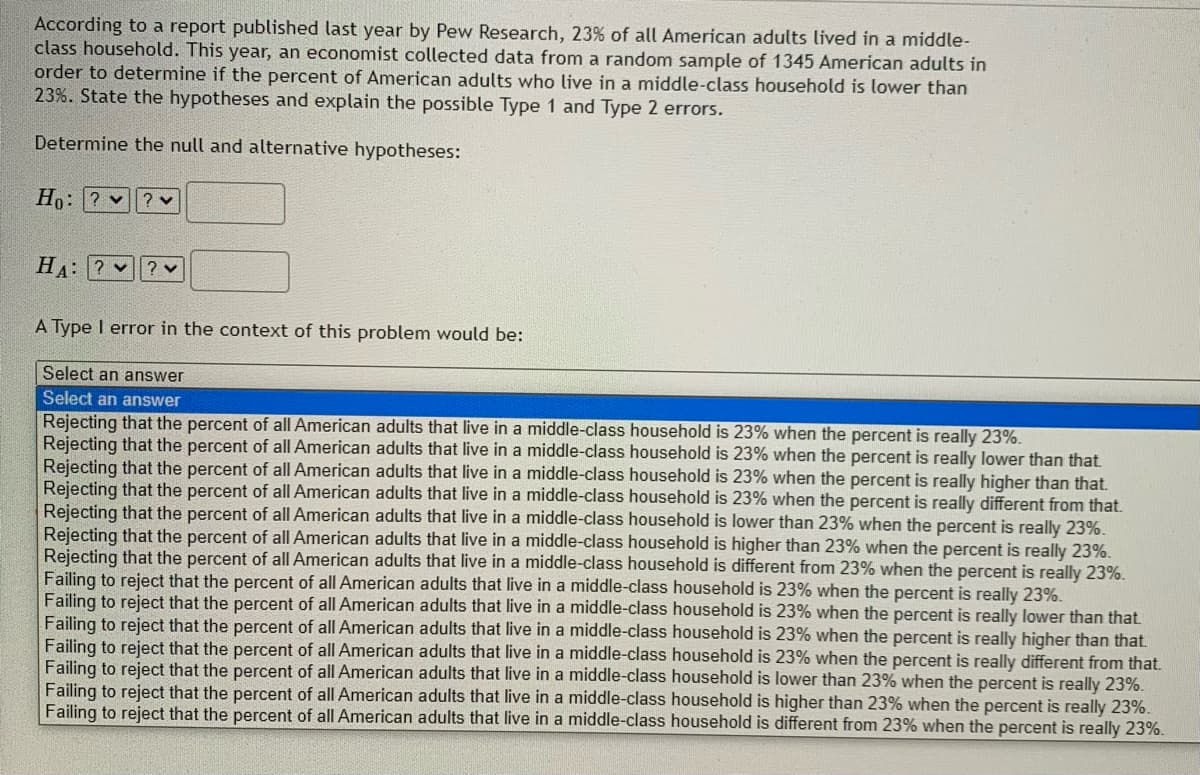
Transcribed Image Text:According to a report published last year by Pew Research, 23% of all American adults lived in a middle-
class household. This year, an economist collected data from a random sample of 1345 American adults in
order to determine if the percent of American adults who live in a middle-class household is lower than
23%. State the hypotheses and explain the possible Type 1 and Type 2 errors.
Determine the null and alternative hypotheses:
Ho: ? v
? v
HA: ?
? v
A Type I error in the context of this problem would be:
Select an answer
Select an answer
Rejecting that the percent of all American adults that live in a middle-class household is 23% when the percent is really 23%.
Rejecting that the percent of all American adults that live in a middle-class household is 23% when the percent is really lower than that.
Rejecting that the percent of all American adults that live in a middle-class household is 23% when the percent is really higher than that.
Rejecting that the percent of all American adults that live in a middle-class household is 23% when the percent is really different from that.
Rejecting that the percent of all American adults that live in a middle-class household is lower than 23% when the percent is really 23%.
Rejecting that the percent of all American adults that live in a middle-class household is higher than 23% when the percent is really 23%.
Rejecting that the percent of all American adults that live in a middle-class household is different from 23% when the percent is really 23%.
Failing to reject that the percent of all American adults that live in a middle-class household is 23% when the percent is really 23%.
Failing to reject that the percent of all American adults that live in a middle-class household is 23% when the percent is really lower than that.
Failing to reject that the percent of all American adults that live in a middle-class household is 23% when the percent is really higher than that.
Failing to reject that the percent of all American adults that live in a middle-class household is 23% when the percent is really different from that.
Failing to reject that the percent of all American adults that live in a middle-class household is lower than 23% when the percent is really 23%.
Failing to reject that the percent of all American adults that live in a middle-class household is higher than 23% when the percent is really 23%.
Failing to reject that the percent of all American adults that live in a middle-class household is different from 23% when the percent is really 23%.
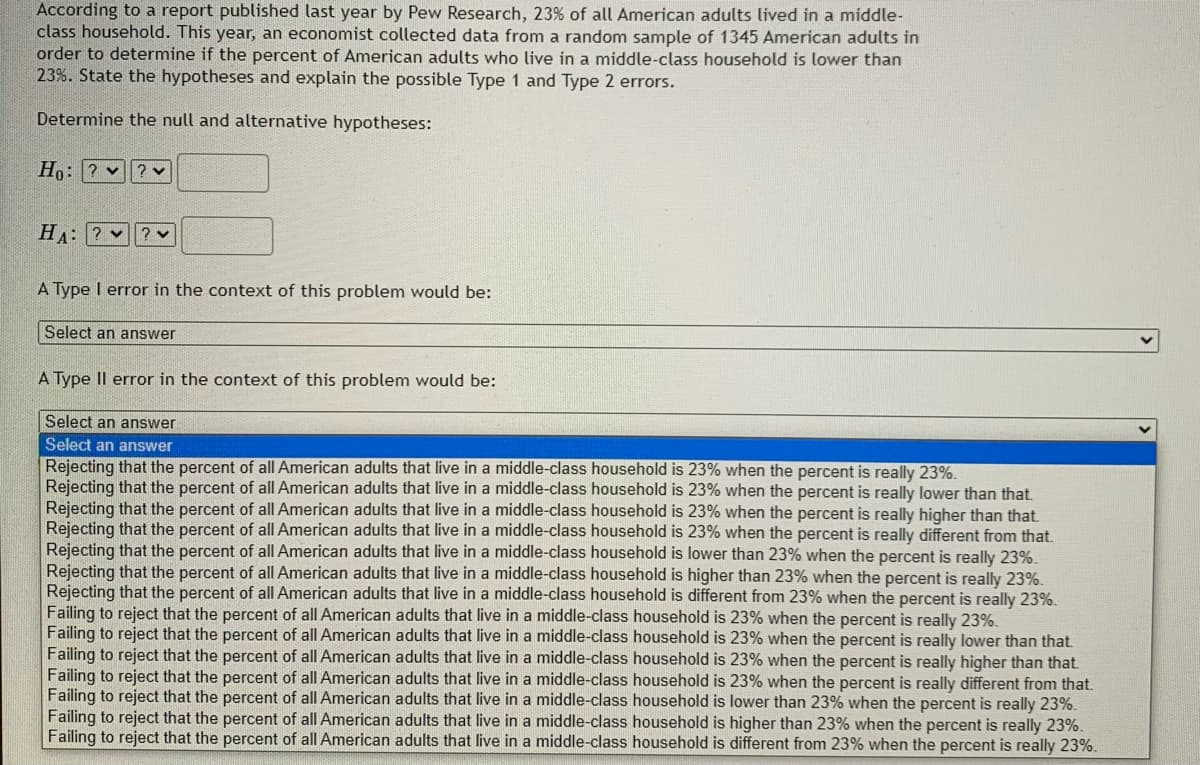
Transcribed Image Text:According to a report published last year by Pew Research, 23% of all American adults lived in a middle-
class household. This year, an economist collected data from a random sample of 1345 American adults in
order to determine if the percent of American adults who live in a middle-class household is lower than
23%. State the hypotheses and explain the possible Type 1 and Type 2 errors.
Determine the null and alternative hypotheses:
H:? v? v
HA: ? v
A Type I error in the context of this problem would be:
Select an answer
A Type Il error in the context of this problem would be:
Select an answer
Select an answer
Rejecting that the percent of all American adults that live in a middle-class household is 23% when the percent is really 23%.
Rejecting that the percent of all American adults that live in a middle-class household is 23% when the percent is really lower than that.
Rejecting that the percent of all American adults that live in a middle-class household is 23% when the percent is really higher than that
Rejecting that the percent of all American adults that live in a middle-class household is 23% when the percent is really different from that.
Rejecting that the percent of all American adults that live in a middle-class household is lower than 23% when the percent is really 23%.
Rejecting that the percent of all American adults that live in a middle-class household is higher than 23% when the percent is really 23%.
Rejecting that the percent of all American adults that live in a middle-class household is different from 23% when the percent is really 23%.
Failing to reject that the percent of all American adults that live in a middle-class household is 23% when the percent is really 23%.
Failing to reject that the percent of all American adults that live in a middle-class household is 23% when the percent is really lower than that.
Failing to reject that the percent of all American adults that live in a middle-class household is 23% when the percent is really higher than that.
Failing to reject that the percent of all American adults that live in a middle-class household is 23% when the percent is really different from that.
Failing to reject that the percent of all American adults that live in a middle-class household is lower than 23% when the percent is really 23%.
Failing to reject that the percent of all American adults that live in a middle-class household is higher than 23% when the percent is really 23%.
Failing to reject that the percent of all American adults that live in a middle-class household is different from 23% when the percent is really 23%.
Expert Solution
This question has been solved!
Explore an expertly crafted, step-by-step solution for a thorough understanding of key concepts.

This is a popular solution!

Trending now
This is a popular solution!

Step by step
Solved in 2 steps with 1 images

Recommended textbooks for you
College Algebra (MindTap Course List)
Algebra
ISBN:
9781305652231
Author:
R. David Gustafson, Jeff Hughes
Publisher:
Cengage Learning
College Algebra (MindTap Course List)
Algebra
ISBN:
9781305652231
Author:
R. David Gustafson, Jeff Hughes
Publisher:
Cengage Learning