According to a report, the standard deviation of monthly cell phone bills was $49.68 three years ago. A researcher suspects that the standard deviation of monthly cell phone bills is different from today. (a) Determine the null and alternative hypotheses. (b) Explain what it would mean to make a Type I error. (c) Explain what it would mean to make a Type Il error. a) State the hypotheses. Ho: (Type integers or decimals. Do not round.) (b) Explain what it would mean to make a Type l error. Choose the correct answer below. O A. The sample evidence did not lead the researcher to believe the standard deviation of the monthly cell phone bill is different from $49.68, when in fact the standard deviation of the bill is different from $49.68. O B. The sample evidence led the researcher to believe the standard deviation of the monthly cell phone bill is higher than $49.68, when in fact the standard deviation of the bill is $49.68. OC. The sample evidence did not lead the researcher to believe the standard deviation of the monthly cell phone bill is higher than $49.68, when in fact the standard deviation of the bill is higher than $49.68. O D. The sample evidence led the researcher to believe the standard deviation of the monthly cell phone bill is different from $49.68, when in fact the standard deviation of the bill is $49.68. (c) Explain what it would mean to make a Type Il error. Choose the correct answer below. O A. The sample evidence led the researcher to believe the standard deviation of the monthly cell phone bill is different from $49.68, when in fact the standard deviation of the bill is different from $49.68. O B. The sample evidence did not lead the researcher to believe the standard deviation of the monthly cell phone bill is higher than $49.68, when in fact the standard deviation of the bill is higher than $49.68. OC. The sample evidence did not lead the researcher to believe the standard deviation of the monthly cell phone bill is different from $49.68, when in fact the standard deviation of the bill is different from $49.68. O D. The sample evidence led the researcher to believe the standard deviation of the monthly cell phone bill is different from $49.68, when in fact the standard deviation of the bill is $49.68.
According to a report, the standard deviation of monthly cell phone bills was $49.68 three years ago. A researcher suspects that the standard deviation of monthly cell phone bills is different from today. (a) Determine the null and alternative hypotheses. (b) Explain what it would mean to make a Type I error. (c) Explain what it would mean to make a Type Il error. a) State the hypotheses. Ho: (Type integers or decimals. Do not round.) (b) Explain what it would mean to make a Type l error. Choose the correct answer below. O A. The sample evidence did not lead the researcher to believe the standard deviation of the monthly cell phone bill is different from $49.68, when in fact the standard deviation of the bill is different from $49.68. O B. The sample evidence led the researcher to believe the standard deviation of the monthly cell phone bill is higher than $49.68, when in fact the standard deviation of the bill is $49.68. OC. The sample evidence did not lead the researcher to believe the standard deviation of the monthly cell phone bill is higher than $49.68, when in fact the standard deviation of the bill is higher than $49.68. O D. The sample evidence led the researcher to believe the standard deviation of the monthly cell phone bill is different from $49.68, when in fact the standard deviation of the bill is $49.68. (c) Explain what it would mean to make a Type Il error. Choose the correct answer below. O A. The sample evidence led the researcher to believe the standard deviation of the monthly cell phone bill is different from $49.68, when in fact the standard deviation of the bill is different from $49.68. O B. The sample evidence did not lead the researcher to believe the standard deviation of the monthly cell phone bill is higher than $49.68, when in fact the standard deviation of the bill is higher than $49.68. OC. The sample evidence did not lead the researcher to believe the standard deviation of the monthly cell phone bill is different from $49.68, when in fact the standard deviation of the bill is different from $49.68. O D. The sample evidence led the researcher to believe the standard deviation of the monthly cell phone bill is different from $49.68, when in fact the standard deviation of the bill is $49.68.

Holt Mcdougal Larson Pre-algebra: Student Edition 2012
1st Edition
ISBN:9780547587776
Author:HOLT MCDOUGAL
Publisher:HOLT MCDOUGAL
Chapter11: Data Analysis And Probability
Section: Chapter Questions
Problem 8CR

Related questions
Topic Video
Question
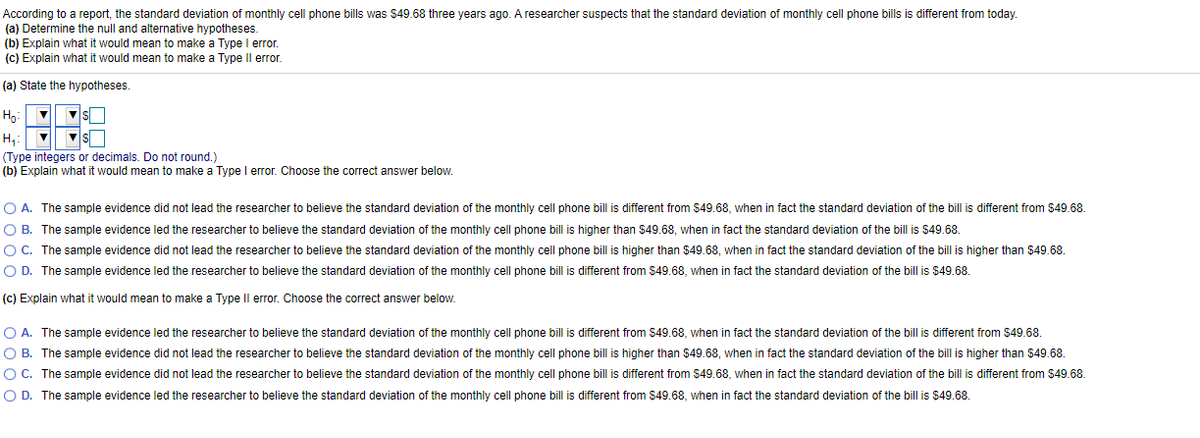
Transcribed Image Text:According to a report, the standard deviation of monthly cell phone bills was $49.68 three years ago. A researcher suspects that the standard deviation of monthly cell phone bills is different from today.
(a) Determine the null and alternative hypotheses.
(b) Explain what it would mean to make a Type I error.
(c) Explain what it would mean to make a Type Il error.
(a) State the hypotheses.
Hg:
H,:
(Type integers or decimals. Do not round.)
(b) Explain what it would mean to make a Type I error. Choose the correct answer below.
O A. The sample evidence did not lead the researcher to believe the standard deviation of the monthly cell phone bill is different from $49.68, when in fact the standard deviation of the bill is different from $49.68.
O B. The sample evidence led the researcher to believe the standard deviation of the monthly cell phone bill is higher than $49.68, when in fact the standard deviation of the bill is $49.68.
OC. The sample evidence did not lead the researcher to believe the standard deviation of the monthly cell phone bill is higher than $49.68, when in fact the standard deviation of the bill is higher than $49.68.
O D. The sample evidence led the researcher to believe the standard deviation of the monthly cell phone bill is different from $49.68, when in fact the standard deviation of the bill is $49.68.
(c) Explain what it would mean to make a Type Il error. Choose the correct answer below.
O A. The sample evidence led the researcher to believe the standard deviation of the monthly cell phone bill is different from $49.68, when in fact the standard deviation of the bill is different from $49.68.
O B. The sample evidence did not lead the researcher to believe the standard deviation of the monthly cell phone bill is higher than $49.68, when in fact the standard deviation of the bill is higher than $49.68.
O C. The sample evidence did not lead the researcher to believe the standard deviation of the monthly cell phone bill is different from $49.68, when in fact the standard deviation of the bill is different from $49.68.
O D. The sample evidence led the researcher to believe the standard deviation of the monthly cell phone bill is different from $49.68, when in fact the standard deviation of the bill is $49.68.
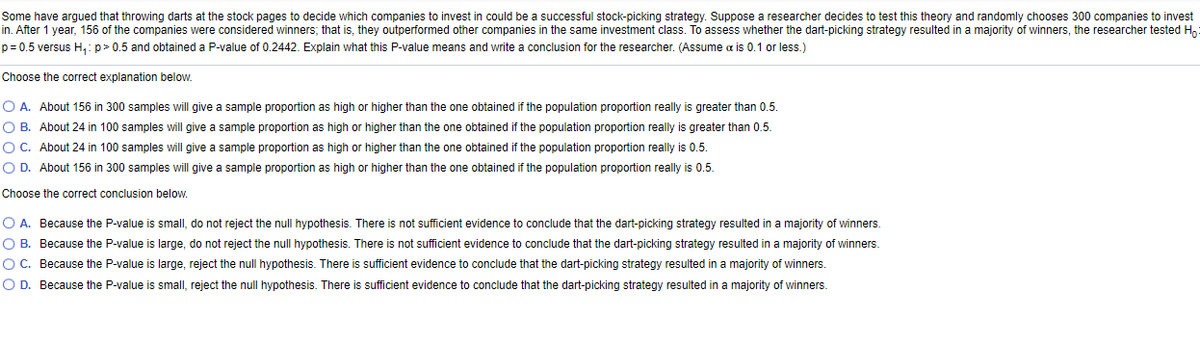
Transcribed Image Text:Some have argued that throwing darts at the stock pages to decide which companies to invest in could be a successful stock-picking strategy. Suppose a researcher decides to test this theory and randomly chooses 300 companies to invest
in. After 1 year, 156 of the companies were considered winners; that is, they outperformed other companies in the same investment class. To assess whether the dart-picking strategy resulted in a majority of winners, the researcher tested H,:
p= 0.5 versus H,: p> 0.5 and obtained a P-value of 0.2442. Explain what this P-value means and write a conclusion for the researcher. (Assume a is 0.1 or less.)
Choose the correct explanation below.
O A. About 156 in 300 samples will give a sample proportion as high or higher than the one obtained if the population proportion really is greater than 0.5.
O B. About 24 in 100 samples will give a sample proportion as high or higher than the one obtained if the population proportion really is greater than 0.5.
OC. About 24 in 100 samples will give a sample proportion as high or higher than the one obtained if the population proportion really is 0.5.
O D. About 156 in 300 samples will give a sample proportion as high or higher than the one obtained if the population proportion really is 0.5.
Choose the correct conclusion below.
O A. Because the P-value is small, do not reject the null hypothesis. There is not sufficient evidence to conclude that the dart-picking strategy resulted in a majority of winners.
O B. Because the P-value is large, do not reject the null hypothesis. There is not sufficient evidence to conclude that the dart-picking strategy resulted in a majority of winners.
OC. Because the P-value is large, reject the null hypothesis. There is sufficient evidence to conclude that the dart-picking strategy resulted in a majority of winners.
O D. Because the P-value is small, reject the null hypothesis. There is sufficient evidence to conclude that the dart-picking strategy resulted in a majority of winners.
Expert Solution
This question has been solved!
Explore an expertly crafted, step-by-step solution for a thorough understanding of key concepts.

This is a popular solution!

Trending now
This is a popular solution!

Step by step
Solved in 3 steps

Knowledge Booster


Learn more about
Need a deep-dive on the concept behind this application? Look no further. Learn more about this topic, statistics and related others by exploring similar questions and additional content below.Recommended textbooks for you
Holt Mcdougal Larson Pre-algebra: Student Edition…
Algebra
ISBN:
9780547587776
Author:
HOLT MCDOUGAL
Publisher:
HOLT MCDOUGAL

College Algebra
Algebra
ISBN:
9781305115545
Author:
James Stewart, Lothar Redlin, Saleem Watson
Publisher:
Cengage Learning
Holt Mcdougal Larson Pre-algebra: Student Edition…
Algebra
ISBN:
9780547587776
Author:
HOLT MCDOUGAL
Publisher:
HOLT MCDOUGAL
College Algebra
Algebra
ISBN:
9781305115545
Author:
James Stewart, Lothar Redlin, Saleem Watson
Publisher:
Cengage Learning