According to a study conducted by an organization, the proportion of Americans who were afraid to fly in 2006 was 0.10. A taadom sample of 1,300 Americans results in 143 indicating that they are afraid to fly Explain why this is not necessarily evidence that the proportion of Americans who are afraid to fly has increased. Click here to view the standard normal distribution table (page 1) Click here to view the standard normal distribution table (page 2). Select the correct choice below and, if necessary, fill in the answer box to coroplete your choice. O A. This is not necessarily evidence that the proportion of Americans wbo are afraid to fly has increased above 0.10 because the value of np(1 -p) is less than 10. O B. This is not necessarily evidence that the proportion of Americans who are afraid to fly hassncreased above 0.10 because the sarple proopcboo,. is very close to 0.10. (Type an integer or a decimal.) OC. This is not necessarily evidence that the proportion of AReTicans who are afraid to fly has increesed above 0 10 because the probability of obtaining a value equal to or more extreme than the sample proportion is which is not unusual. (Round to four decimal places as needed.) O D. This is not necessarily evidence that the proportion of Americans who are afraid to fly has increased above 0.10 because the sample size n is more than 5% of the population.
According to a study conducted by an organization, the proportion of Americans who were afraid to fly in 2006 was 0.10. A taadom sample of 1,300 Americans results in 143 indicating that they are afraid to fly Explain why this is not necessarily evidence that the proportion of Americans who are afraid to fly has increased. Click here to view the standard normal distribution table (page 1) Click here to view the standard normal distribution table (page 2). Select the correct choice below and, if necessary, fill in the answer box to coroplete your choice. O A. This is not necessarily evidence that the proportion of Americans wbo are afraid to fly has increased above 0.10 because the value of np(1 -p) is less than 10. O B. This is not necessarily evidence that the proportion of Americans who are afraid to fly hassncreased above 0.10 because the sarple proopcboo,. is very close to 0.10. (Type an integer or a decimal.) OC. This is not necessarily evidence that the proportion of AReTicans who are afraid to fly has increesed above 0 10 because the probability of obtaining a value equal to or more extreme than the sample proportion is which is not unusual. (Round to four decimal places as needed.) O D. This is not necessarily evidence that the proportion of Americans who are afraid to fly has increased above 0.10 because the sample size n is more than 5% of the population.

MATLAB: An Introduction with Applications
6th Edition
ISBN:9781119256830
Author:Amos Gilat
Publisher:Amos Gilat
Chapter1: Starting With Matlab
Section: Chapter Questions
Problem 1P

Related questions

Question
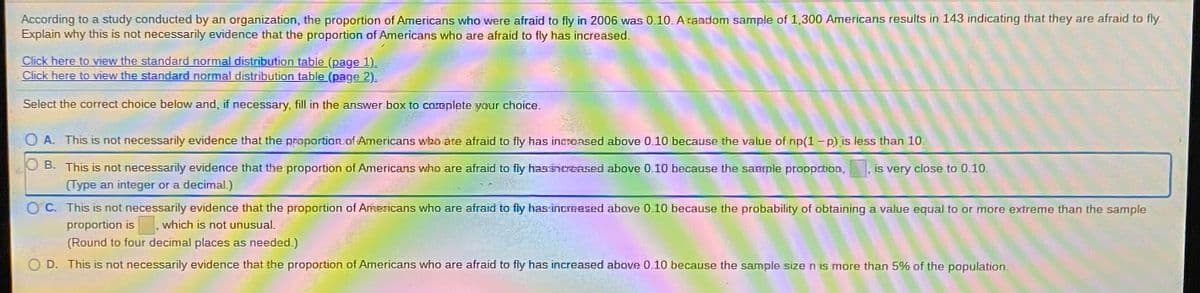
Transcribed Image Text:According to a study conducted by an organization, the proportion of Americans who were afraid to fly in 2006 was 0.10. A raadom sample of 1,300 Americans results in 143 indicating that they are afraid to fly.
Explain why this is not necessarily evidence that the proportion of Americans who are afraid to fly has increased.
Click here to view the standard normal distribution table (page 1).
Click here to view the standard normal distribution table (page 2).
Select the correct choice below and, if necessary, fill in the answer box to coreplete your choice.
O A. This is not necessarily evidence that the proportion of Americans wbn are afraid to fly has incrensed above 0.10 because the value of np(1-p) is less than 10.
O B. This is not necessarily evidence that the proportion of Americans who are afraid to fly hassnrGAsed above 0.10 because the saaple proopation,
(Type an integer or a decimal.)
is very close to 0.10.
C. This is not necessarily evidence that the proportion of ArmTicans who are afraid to fly has increesed above 0.10 because the probability of obtaining a value equal to or more extreme than the sample
proportion is
which is not unusual.
(Round to four decimal places as needed.)
O D. This is not necessarily evidence that the proportion of Americans who are afraid to fly has increased above 0.10 because the sample size n is more than 5% of the population.
Expert Solution
This question has been solved!
Explore an expertly crafted, step-by-step solution for a thorough understanding of key concepts.

This is a popular solution!

Trending now
This is a popular solution!

Step by step
Solved in 3 steps with 2 images

Knowledge Booster


Learn more about
Need a deep-dive on the concept behind this application? Look no further. Learn more about this topic, statistics and related others by exploring similar questions and additional content below.Recommended textbooks for you
MATLAB: An Introduction with Applications
Statistics
ISBN:
9781119256830
Author:
Amos Gilat
Publisher:
John Wiley & Sons Inc

Probability and Statistics for Engineering and th…
Statistics
ISBN:
9781305251809
Author:
Jay L. Devore
Publisher:
Cengage Learning

Statistics for The Behavioral Sciences (MindTap C…
Statistics
ISBN:
9781305504912
Author:
Frederick J Gravetter, Larry B. Wallnau
Publisher:
Cengage Learning
MATLAB: An Introduction with Applications
Statistics
ISBN:
9781119256830
Author:
Amos Gilat
Publisher:
John Wiley & Sons Inc
Probability and Statistics for Engineering and th…
Statistics
ISBN:
9781305251809
Author:
Jay L. Devore
Publisher:
Cengage Learning
Statistics for The Behavioral Sciences (MindTap C…
Statistics
ISBN:
9781305504912
Author:
Frederick J Gravetter, Larry B. Wallnau
Publisher:
Cengage Learning

Elementary Statistics: Picturing the World (7th E…
Statistics
ISBN:
9780134683416
Author:
Ron Larson, Betsy Farber
Publisher:
PEARSON

The Basic Practice of Statistics
Statistics
ISBN:
9781319042578
Author:
David S. Moore, William I. Notz, Michael A. Fligner
Publisher:
W. H. Freeman

Introduction to the Practice of Statistics
Statistics
ISBN:
9781319013387
Author:
David S. Moore, George P. McCabe, Bruce A. Craig
Publisher:
W. H. Freeman