According to the "4-Quadrant Model" (4QM), which of the following statement is correct? O If there is a positive demand shock in the space market, the housing rent is going to increase in the short run, and will be lower than the current rent in the long run. O If there is a positive demand shock in the space market, the housing price is going to decrease in the short run, and increase in the long run. O If there is a positive demand shock in the asset market, the housing rent is going to decrease in the long run. O If there is a positive demand shock in the asset market, the housing price is going to decrease in the short run, and will be lower than the current price in the long run.
According to the "4-Quadrant Model" (4QM), which of the following statement is correct? O If there is a positive demand shock in the space market, the housing rent is going to increase in the short run, and will be lower than the current rent in the long run. O If there is a positive demand shock in the space market, the housing price is going to decrease in the short run, and increase in the long run. O If there is a positive demand shock in the asset market, the housing rent is going to decrease in the long run. O If there is a positive demand shock in the asset market, the housing price is going to decrease in the short run, and will be lower than the current price in the long run.

Economics (MindTap Course List)
13th Edition
ISBN:9781337617383
Author:Roger A. Arnold
Publisher:Roger A. Arnold
Chapter9: Classical Macroeconomics And The Self Regulating Economy
Section: Chapter Questions
Problem 14QP

Related questions
Question
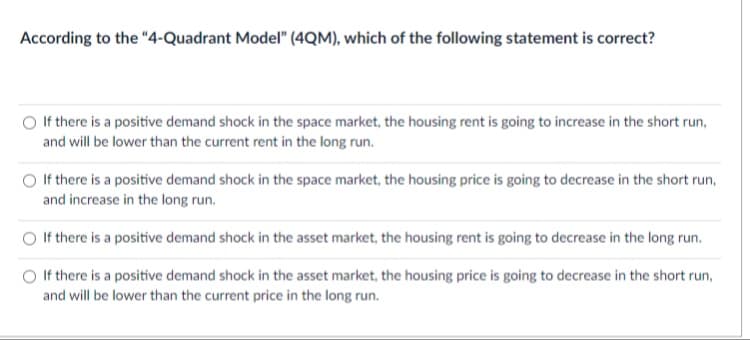
Transcribed Image Text:According to the "4-Quadrant Model" (4QM), which of the following statement is correct?
O If there is a positive demand shock in the space market, the housing rent is going to increase in the short run,
and will be lower than the current rent in the long run.
If there is a positive demand shock in the space market, the housing price is going to decrease in the short run,
and increase in the long run.
If there is a positive demand shock in the asset market, the housing rent is going to decrease in the long run.
O If there is a positive demand shock in the asset market, the housing price is going to decrease in the short run,
and will be lower than the current price in the long run.
Expert Solution
This question has been solved!
Explore an expertly crafted, step-by-step solution for a thorough understanding of key concepts.

This is a popular solution!

Trending now
This is a popular solution!

Step by step
Solved in 3 steps

Knowledge Booster


Learn more about
Need a deep-dive on the concept behind this application? Look no further. Learn more about this topic, economics and related others by exploring similar questions and additional content below.Recommended textbooks for you
Economics (MindTap Course List)
Economics
ISBN:
9781337617383
Author:
Roger A. Arnold
Publisher:
Cengage Learning

Economics (MindTap Course List)
Economics
ISBN:
9781337617383
Author:
Roger A. Arnold
Publisher:
Cengage Learning