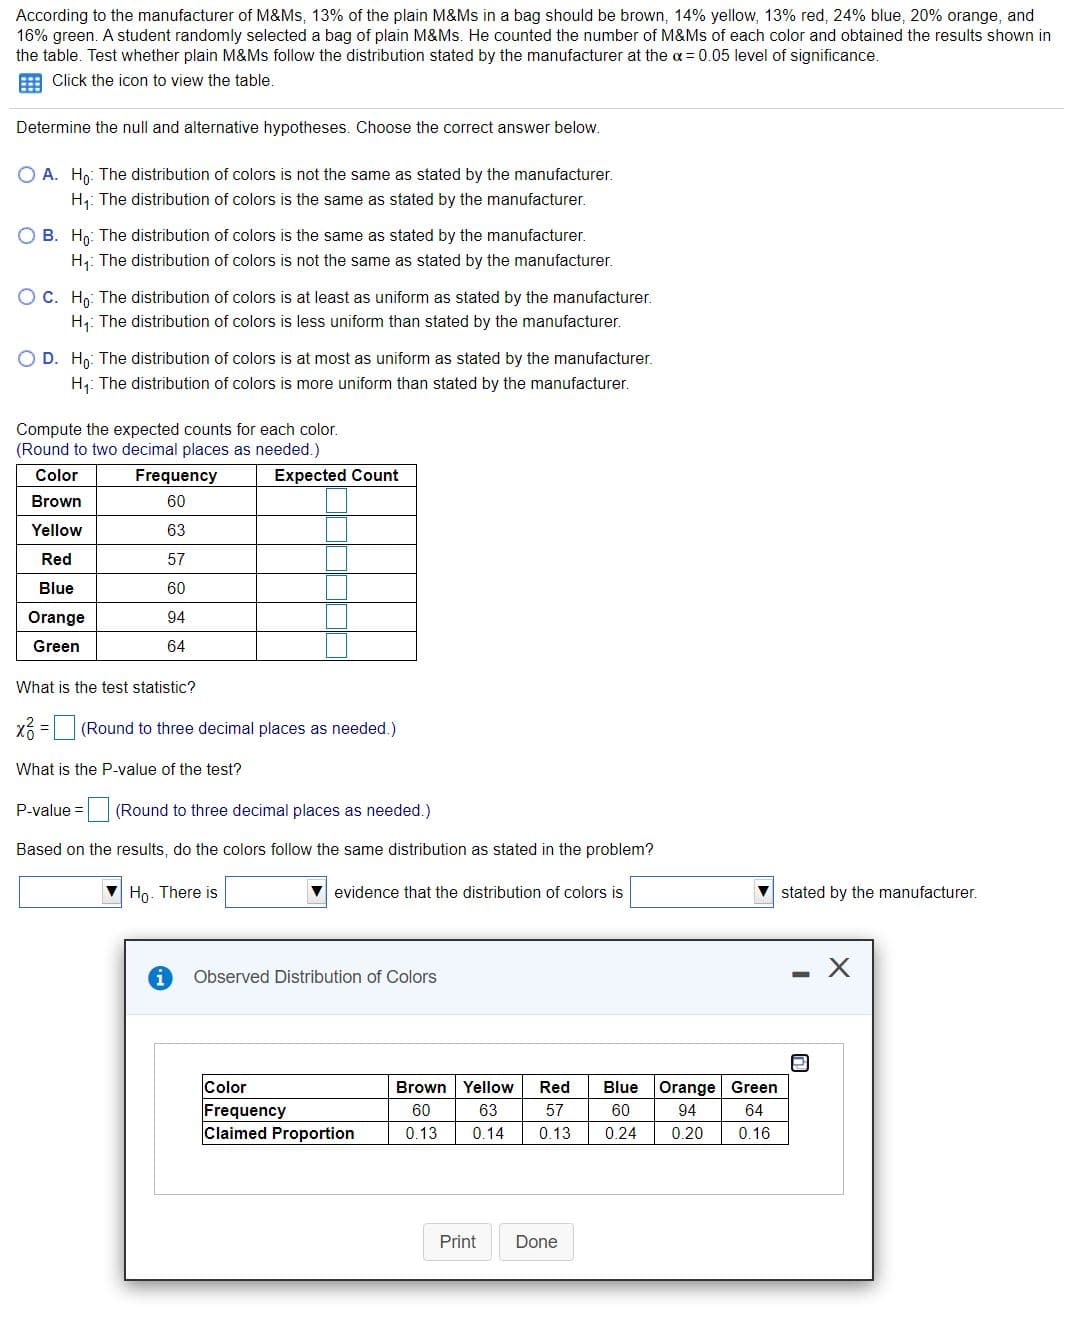
According to the manufacturer of M&Ms, 13% of the plain M&Ms in a bag should be brown, 14% yellow, 13% red, 24% blue, 20% orange, and 16% green. A student randomly selected a bag of plain M&Ms. He counted the number of M&Ms of each color and obtained the results shown in the table. Test whether plain M&Ms follow the distribution stated by the manufacturer at the a = 0.05 level of significance. E Click the icon to view the table. Determine the null and alternative hypotheses. Choose the correct answer below. O A. Ho: The distribution of colors is not the same as stated by the manufacturer. H: The distribution of colors is the same as stated by the manufacturer. O B. Hn: The distribution of colors is the same as stated by the manufacturer. H;: The distribution of colors is not the same as stated by the manufacturer. OC. Ho: The distribution of colors is at least as uniform as stated by the manufacturer. H1: The distribution of colors is less uniform than stated by the manufacturer. O D. Hn: The distribution of colors is at most as uniform as stated by the manufacturer. H,: The distribution of colors is more uniform than stated by the manufacturer. Compute the expected counts for each color. (Round to two decimal places as needed.) Color Frequency Expected Count Brown 60 Yellow 63 Red 57 Blue 60 Orange 94 Green 64 What is the test statistic? X6 = (Round to three decimal places as needed.) What is the P-value of the test? P-value = (Round to three decimal places as needed.) Based on the results, do the colors follow the same distribution as stated in the problem? V Ho. There is V evidence that the distribution of colors is V stated by the manufacturer. Observed Distribution of Colors Color Brown Yellow Red Blue Orange Green Frequency Claimed Proportion 60 63 57 60 94 64 0.13 0.14 0.13 0.24 0.20 0.16 Print Done
According to the manufacturer of M&Ms, 13% of the plain M&Ms in a bag should be brown, 14% yellow, 13% red, 24% blue, 20% orange, and 16% green. A student randomly selected a bag of plain M&Ms. He counted the number of M&Ms of each color and obtained the results shown in the table. Test whether plain M&Ms follow the distribution stated by the manufacturer at the a = 0.05 level of significance. E Click the icon to view the table. Determine the null and alternative hypotheses. Choose the correct answer below. O A. Ho: The distribution of colors is not the same as stated by the manufacturer. H: The distribution of colors is the same as stated by the manufacturer. O B. Hn: The distribution of colors is the same as stated by the manufacturer. H;: The distribution of colors is not the same as stated by the manufacturer. OC. Ho: The distribution of colors is at least as uniform as stated by the manufacturer. H1: The distribution of colors is less uniform than stated by the manufacturer. O D. Hn: The distribution of colors is at most as uniform as stated by the manufacturer. H,: The distribution of colors is more uniform than stated by the manufacturer. Compute the expected counts for each color. (Round to two decimal places as needed.) Color Frequency Expected Count Brown 60 Yellow 63 Red 57 Blue 60 Orange 94 Green 64 What is the test statistic? X6 = (Round to three decimal places as needed.) What is the P-value of the test? P-value = (Round to three decimal places as needed.) Based on the results, do the colors follow the same distribution as stated in the problem? V Ho. There is V evidence that the distribution of colors is V stated by the manufacturer. Observed Distribution of Colors Color Brown Yellow Red Blue Orange Green Frequency Claimed Proportion 60 63 57 60 94 64 0.13 0.14 0.13 0.24 0.20 0.16 Print Done

Glencoe Algebra 1, Student Edition, 9780079039897, 0079039898, 2018
18th Edition
ISBN:9780079039897
Author:Carter
Publisher:Carter
Chapter10: Statistics
Section10.6: Summarizing Categorical Data
Problem 10CYU

Related questions

Question
Transcribed Image Text:According to the manufacturer of M&Ms, 13% of the plain M&Ms in a bag should be brown, 14% yellow, 13% red, 24% blue, 20% orange, and
16% green. A student randomly selected a bag of plain M&Ms. He counted the number of M&Ms of each color and obtained the results shown in
the table. Test whether plain M&Ms follow the distribution stated by the manufacturer at the a = 0.05 level of significance.
E Click the icon to view the table.
Determine the null and alternative hypotheses. Choose the correct answer below.
O A. Ho: The distribution of colors is not the same as stated by the manufacturer.
H: The distribution of colors is the same as stated by the manufacturer.
O B. Hn: The distribution of colors is the same as stated by the manufacturer.
H;: The distribution of colors is not the same as stated by the manufacturer.
O C. Ho: The distribution of colors is at least as uniform as stated by the manufacturer.
H,: The distribution of colors is less uniform than stated by the manufacturer.
O D. Hn: The distribution of colors is at most as uniform as stated by the manufacturer.
H;: The distribution of colors is more uniform than stated by the manufacturer.
Compute the expected counts for each color.
(Round to two decimal places as needed.)
Color
Frequency
Expected Count
Brown
60
Yellow
63
Red
57
Blue
60
Orange
94
Green
64
What is the test statistic?
x = (Round to three decimal places as needed.)
What is the P-value of the test?
P-value = (Round to three decimal places as needed.)
Based on the results, do the colors follow the same distribution as stated in the problem?
Ho. There is
V evidence that the distribution of colors is
V stated by the manufacturer.
Observed Distribution of Colors
Color
Frequency
Claimed Proportion
Brown Yellow
Red
Blue
Orange Green
60
63
57
60
94
64
0.13
0.14
0.13
0.24
0.20
0.16
Print
Done
Expert Solution
This question has been solved!
Explore an expertly crafted, step-by-step solution for a thorough understanding of key concepts.

This is a popular solution!

Trending now
This is a popular solution!

Step by step
Solved in 2 steps with 2 images

Knowledge Booster


Learn more about
Need a deep-dive on the concept behind this application? Look no further. Learn more about this topic, statistics and related others by exploring similar questions and additional content below.Recommended textbooks for you
Glencoe Algebra 1, Student Edition, 9780079039897…
Algebra
ISBN:
9780079039897
Author:
Carter
Publisher:
McGraw Hill

Holt Mcdougal Larson Pre-algebra: Student Edition…
Algebra
ISBN:
9780547587776
Author:
HOLT MCDOUGAL
Publisher:
HOLT MCDOUGAL

Big Ideas Math A Bridge To Success Algebra 1: Stu…
Algebra
ISBN:
9781680331141
Author:
HOUGHTON MIFFLIN HARCOURT
Publisher:
Houghton Mifflin Harcourt
Glencoe Algebra 1, Student Edition, 9780079039897…
Algebra
ISBN:
9780079039897
Author:
Carter
Publisher:
McGraw Hill
Holt Mcdougal Larson Pre-algebra: Student Edition…
Algebra
ISBN:
9780547587776
Author:
HOLT MCDOUGAL
Publisher:
HOLT MCDOUGAL
Big Ideas Math A Bridge To Success Algebra 1: Stu…
Algebra
ISBN:
9781680331141
Author:
HOUGHTON MIFFLIN HARCOURT
Publisher:
Houghton Mifflin Harcourt