The type of household for the U.S. population and for a random sample of 411 households from a community in Montana are shown below. Percent of U.S. Households Observed Number of Households in the Community Type of Household Married with children 26% 108 Married, no children 29% 101 Single parent 9% 37 One person 25% 102 Other (e.g., roommates, siblings) 11% 63 n USE SALT Use a 5% level of significance to test the claim that the distribution of U.S. households fits the Dove Creek distribution. (a) What is the level of significance? 0.05 State the null and alternate hypotheses. O Ho: The distributions are the same. H,: The distributions are different. O Ho: The distributions are different. H,: The distributions are the same. O Ho: The distributions are different. H,: The distributions are different. O Ho: The distributions are the same. H,: The distributions are same. (b) Find the value of the chi-square statistic for the sample. (Round the expected frequencies to two decimal places. Round the test statistic to three decimal places.) Are all the expected frequencies greater than 5? O Yes O No What sampling distribution will you use? O Student's t O chi-square O binomial MacBook Pro
The type of household for the U.S. population and for a random sample of 411 households from a community in Montana are shown below. Percent of U.S. Households Observed Number of Households in the Community Type of Household Married with children 26% 108 Married, no children 29% 101 Single parent 9% 37 One person 25% 102 Other (e.g., roommates, siblings) 11% 63 n USE SALT Use a 5% level of significance to test the claim that the distribution of U.S. households fits the Dove Creek distribution. (a) What is the level of significance? 0.05 State the null and alternate hypotheses. O Ho: The distributions are the same. H,: The distributions are different. O Ho: The distributions are different. H,: The distributions are the same. O Ho: The distributions are different. H,: The distributions are different. O Ho: The distributions are the same. H,: The distributions are same. (b) Find the value of the chi-square statistic for the sample. (Round the expected frequencies to two decimal places. Round the test statistic to three decimal places.) Are all the expected frequencies greater than 5? O Yes O No What sampling distribution will you use? O Student's t O chi-square O binomial MacBook Pro

Glencoe Algebra 1, Student Edition, 9780079039897, 0079039898, 2018
18th Edition
ISBN:9780079039897
Author:Carter
Publisher:Carter
Chapter10: Statistics
Section10.6: Summarizing Categorical Data
Problem 10CYU

Related questions
Question
please complete the blank problem and or ones with a red x next to it
not ones with a green check next to please
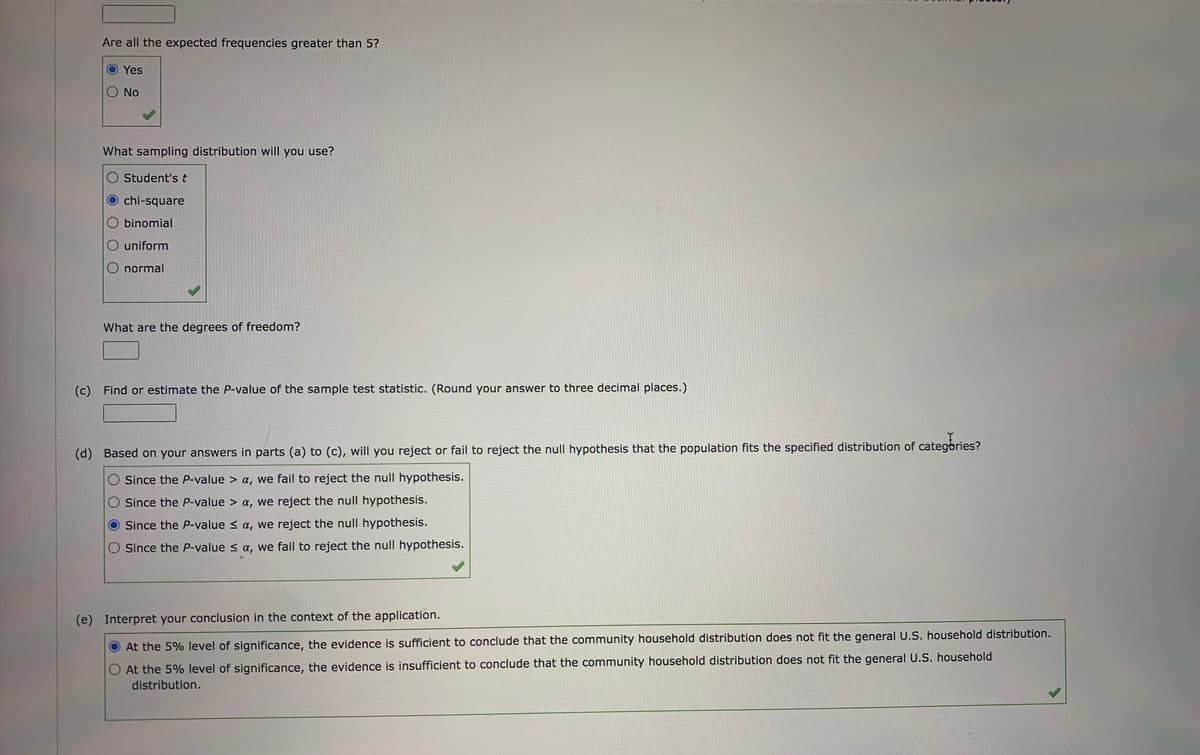
Transcribed Image Text:Are all the expected frequencies greater than 5?
Yes
No
What sampling distribution will you use?
Student's t
O chi-square
O binomial
O uniform
O normal
What are the degrees of freedom?
(c) Find or estimate the P-value of the sample test statistic. (Round your answer to three decimal places.)
(d) Based on your answers in parts (a) to (c), will you reject or fail to reject the null hypothesis that the population fits the specified distribution of categbries?
O Since the P-value > a, we fail to reject the null hypothesis.
O Since the P-value > a, we reject the null hypothesis.
Since the P-value < a, we reject the null hypothesis.
O Since the P-value s a, we fail to reject the null hypothesis.
(e) Interpret your conclusion in the context of the application.
O At the 5% level of significance, the evidence is sufficient to conclude that the community household distribution does not fit the general U.S. household distribution.
At the 5% level of significance, the evidence is insufficient to conclude that the community household distribution does not fit the general U.S. household
distribution.
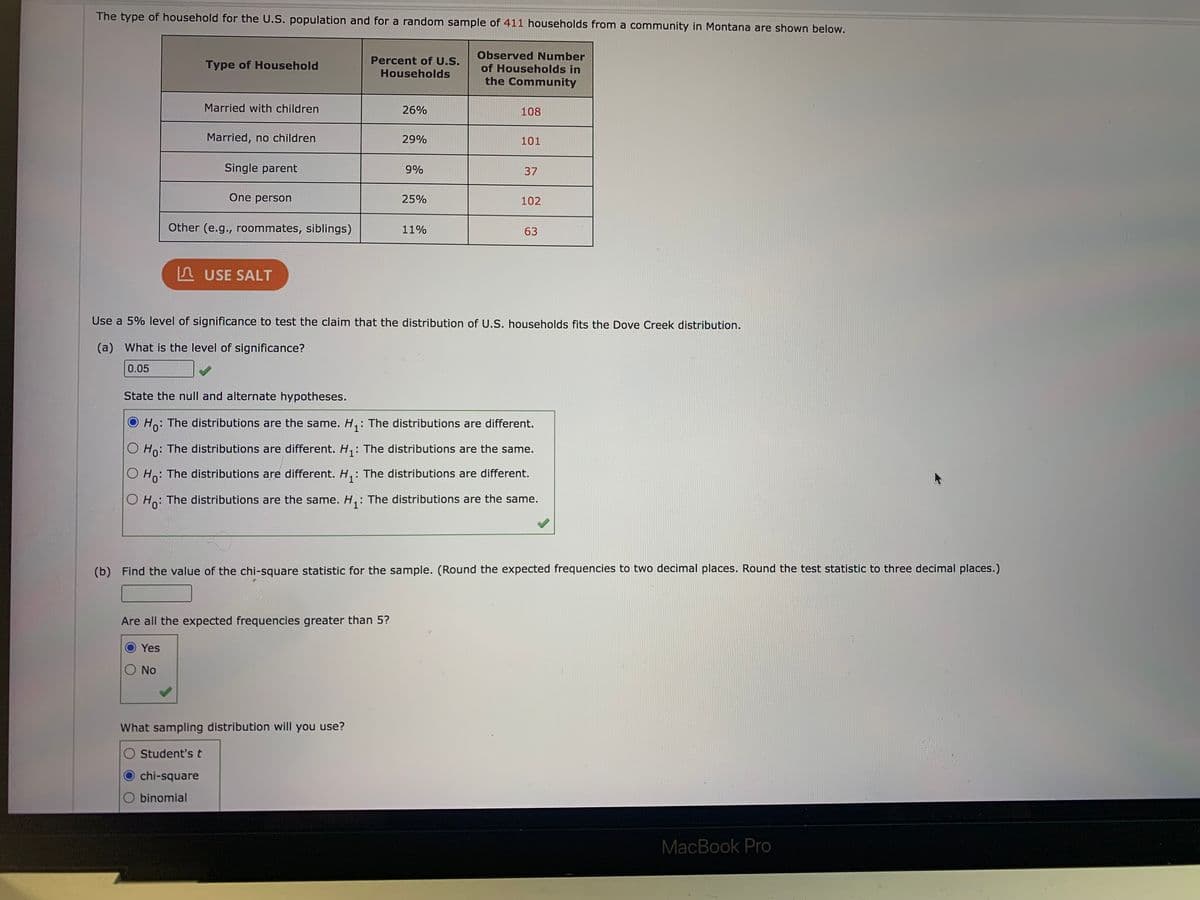
Transcribed Image Text:The type of household for the U.S. population and for a random sample of 411 households from a community in Montana are shown below.
Observed Number
Percent of U.S.
Type of Household
of Households in
Households
the Community
Married with children
26%
108
Married, no children
29%
101
Single parent
9%
37
One person
25%
102
Other (e.g., roommates, siblings)
11%
63
A USE SALT
Use a 5% level of significance to test the claim that the distribution of U.S. households fits the Dove Creek distribution.
(a) What is the level of significance?
0.05
State the null and alternate hypotheses.
Ho: The distributions are the same. H,: The distributions are different.
O Ho: The distributions are different. H,: The distributions are the same.
The distributions are different.
Ho:
: The distributions are different.
O Ho: The distributions are the same. H,: The distributions are the same.
(b) Find the value of the chi-square statistic for the sample. (Round the expected frequencies to two decimal places. Round the test statistic to three decimal places.)
Are all the expected frequencies greater than 5?
Yes
No
What sampling distribution will you use?
O Student's t
chi-square
O binomial
MacBook Pro
Expert Solution
This question has been solved!
Explore an expertly crafted, step-by-step solution for a thorough understanding of key concepts.

This is a popular solution!

Trending now
This is a popular solution!

Step by step
Solved in 3 steps with 2 images

Recommended textbooks for you
Glencoe Algebra 1, Student Edition, 9780079039897…
Algebra
ISBN:
9780079039897
Author:
Carter
Publisher:
McGraw Hill

Holt Mcdougal Larson Pre-algebra: Student Edition…
Algebra
ISBN:
9780547587776
Author:
HOLT MCDOUGAL
Publisher:
HOLT MCDOUGAL

College Algebra (MindTap Course List)
Algebra
ISBN:
9781305652231
Author:
R. David Gustafson, Jeff Hughes
Publisher:
Cengage Learning
Glencoe Algebra 1, Student Edition, 9780079039897…
Algebra
ISBN:
9780079039897
Author:
Carter
Publisher:
McGraw Hill
Holt Mcdougal Larson Pre-algebra: Student Edition…
Algebra
ISBN:
9780547587776
Author:
HOLT MCDOUGAL
Publisher:
HOLT MCDOUGAL
College Algebra (MindTap Course List)
Algebra
ISBN:
9781305652231
Author:
R. David Gustafson, Jeff Hughes
Publisher:
Cengage Learning