The type of household for the U.S. population and for a random sample of 411 households from a community in Montana are shown below. Type of Household Percent of U.S. Households Observed Number of Households in the Community Married with children 26% 108 Married, no children 29% 111 Single parent 9% 37 One person 25% 90 Other (e.g., roommates, siblings) 11% 65 LAUSE SALT Use a 5% level of significance to test the claim that the distribution of U.S. households fits the Dove Creek distribution. (a) What is the level of significance? State the null and alternate hypotheses. OH: The distributions are the same. H₁: The distributions are different. OH,: The distributions are the same. H₁: The distributions are the same. OH,: The distributions are different. H₁: The distributions are the same. OH: The distributions are different. H₁: The distributions are different. (b) Find the value of the chi-square statistic for the sample. (Round the expected frequencies to two decimal places. Round the test statistic to three decimal places.) Are all the expected frequencies greater than 5? Yes O No What sampling distribution will you use? O Student's t chi-square O binomial O normal O uniform What are the degrees of freedom? (c) Find or estimate the P-value of the sample test statistic. (Round your answer to three decimal places.) (d) Based on your answers in parts (a) to (c), will you reject or fail to reject the null hypothesis that the population fits the specified distribution of categories? O Since the P-value > a, we fail to reject the null hypothesis. O Since the P-value > a, we reject the null hypothesis. O Since the P-value sa, we reject the null hypothesis. O Since the P-value sa, we fail to reject the null hypothesis. (e) Interpret your conclusion in the context of the application. O At the 5% level of significance, the evidence is sufficient to conclude that the community household distribution does not fit the general U.S. household distribution. O At the 5% level of significance, the evidence is insufficient to conclude that the community household distribution does not fit the general U.S. household distribution.
The type of household for the U.S. population and for a random sample of 411 households from a community in Montana are shown below. Type of Household Percent of U.S. Households Observed Number of Households in the Community Married with children 26% 108 Married, no children 29% 111 Single parent 9% 37 One person 25% 90 Other (e.g., roommates, siblings) 11% 65 LAUSE SALT Use a 5% level of significance to test the claim that the distribution of U.S. households fits the Dove Creek distribution. (a) What is the level of significance? State the null and alternate hypotheses. OH: The distributions are the same. H₁: The distributions are different. OH,: The distributions are the same. H₁: The distributions are the same. OH,: The distributions are different. H₁: The distributions are the same. OH: The distributions are different. H₁: The distributions are different. (b) Find the value of the chi-square statistic for the sample. (Round the expected frequencies to two decimal places. Round the test statistic to three decimal places.) Are all the expected frequencies greater than 5? Yes O No What sampling distribution will you use? O Student's t chi-square O binomial O normal O uniform What are the degrees of freedom? (c) Find or estimate the P-value of the sample test statistic. (Round your answer to three decimal places.) (d) Based on your answers in parts (a) to (c), will you reject or fail to reject the null hypothesis that the population fits the specified distribution of categories? O Since the P-value > a, we fail to reject the null hypothesis. O Since the P-value > a, we reject the null hypothesis. O Since the P-value sa, we reject the null hypothesis. O Since the P-value sa, we fail to reject the null hypothesis. (e) Interpret your conclusion in the context of the application. O At the 5% level of significance, the evidence is sufficient to conclude that the community household distribution does not fit the general U.S. household distribution. O At the 5% level of significance, the evidence is insufficient to conclude that the community household distribution does not fit the general U.S. household distribution.

Holt Mcdougal Larson Pre-algebra: Student Edition 2012
1st Edition
ISBN:9780547587776
Author:HOLT MCDOUGAL
Publisher:HOLT MCDOUGAL
Chapter11: Data Analysis And Probability
Section: Chapter Questions
Problem 8CR

Related questions
Question
Q7. Please Help
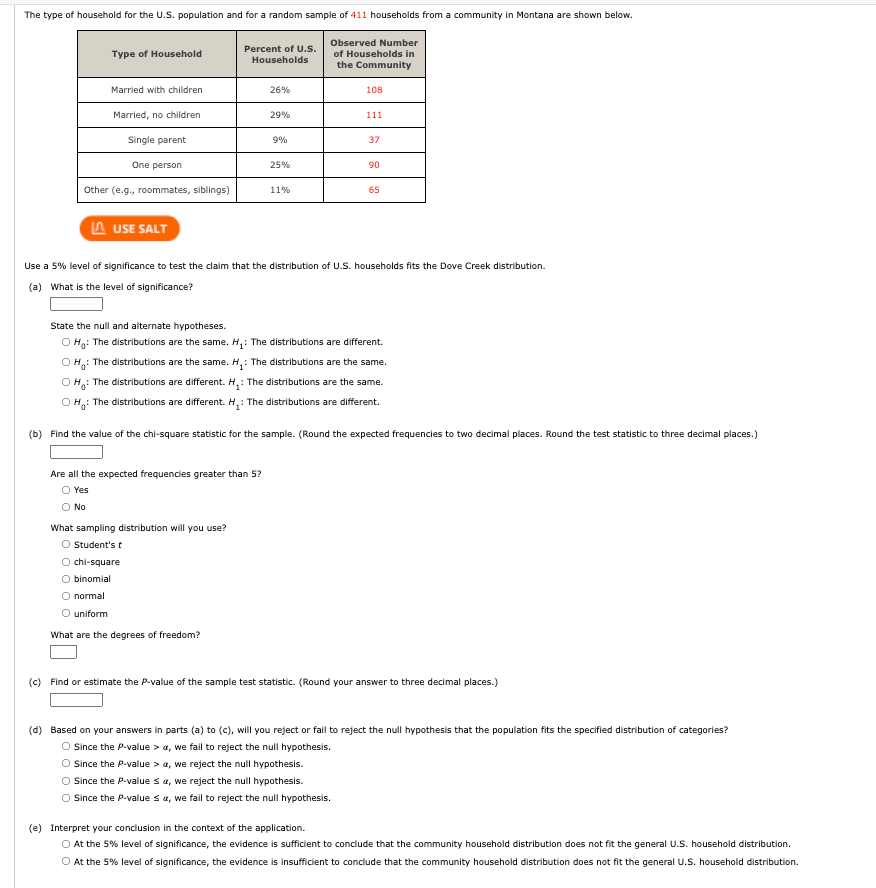
Transcribed Image Text:The type of household for the U.S. population and for a random sample of 411 households from a community in Montana are shown below.
Type of Household
Percent of U.S.
Households
Observed Number
of Households in
the Community
Married with children
26%
108
Married, no children
29%
111
Single parent
9%
37
One person
25%
90
Other (e.g., roommates, siblings)
11%
65
USE SALT
Use a 5% level of significance to test the claim that the distribution of U.S. households fits the Dove Creek distribution.
(a) What is the level of significance?
State the null and alternate hypotheses.
OH: The distributions are the same. H₁: The distributions are different.
OH: The distributions are the same. H₁: The distributions are the same.
OH: The distributions are different. H₁: The distributions are the same.
OH: The distributions are different. H₁: The distributions are different.
(b) Find the value of the chi-square statistic for the sample. (Round the expected frequencies to two decimal places. Round the test statistic to three decimal places.)
Are all the expected frequencies greater than 5?
O Yes
O No
What sampling distribution will you use?
O Student's t
O chi-square
O binomial
O normal
O uniform
What are the degrees of freedom?
(c) Find or estimate the P-value of the sample test statistic. (Round your answer to three decimal places.)
(d) Based on your answers in parts (a) to (c), will you reject or fail to reject the null hypothesis that the population fits the specified distribution of categories?
O Since the P-value > a, we fail to reject the null hypothesis.
O Since the P-value > a, we reject the null hypothesis.
O Since the P-value sa, we reject the null hypothesis.
O Since the P-value sa, we fail to reject the null hypothesis.
(e) Interpret your conclusion in the context of the application.
O At the 5% level of significance, the evidence is sufficient to conclude that the community household distribution does not fit the general U.S. household distribution.
O At the 5% level of significance, the evidence is insufficient to conclude that the community household distribution does not fit the general U.S. household distribution.
Expert Solution
This question has been solved!
Explore an expertly crafted, step-by-step solution for a thorough understanding of key concepts.

Step by step
Solved in 2 steps with 1 images

Recommended textbooks for you
Holt Mcdougal Larson Pre-algebra: Student Edition…
Algebra
ISBN:
9780547587776
Author:
HOLT MCDOUGAL
Publisher:
HOLT MCDOUGAL

College Algebra (MindTap Course List)
Algebra
ISBN:
9781305652231
Author:
R. David Gustafson, Jeff Hughes
Publisher:
Cengage Learning
Holt Mcdougal Larson Pre-algebra: Student Edition…
Algebra
ISBN:
9780547587776
Author:
HOLT MCDOUGAL
Publisher:
HOLT MCDOUGAL
College Algebra (MindTap Course List)
Algebra
ISBN:
9781305652231
Author:
R. David Gustafson, Jeff Hughes
Publisher:
Cengage Learning