According to the midpoint method, the price elasticity of demand between points A and B is approximately Suppose the price of scooters is currently $125 per scooter, shown as point B on the initial graph. Because the demand between points A and B is a $25-per-scooter increase in price will lead to in total revenue per week. In general, in order for a price increase to cause a decrease in total revenue, demand must be
According to the midpoint method, the price elasticity of demand between points A and B is approximately Suppose the price of scooters is currently $125 per scooter, shown as point B on the initial graph. Because the demand between points A and B is a $25-per-scooter increase in price will lead to in total revenue per week. In general, in order for a price increase to cause a decrease in total revenue, demand must be

Chapter5: Elasticity Of Demand And Supply
Section: Chapter Questions
Problem 1.1P: (Calculating Price Elasticity of Demand) Suppose that 50 units of a good are demanded at a price of...

Related questions
Question
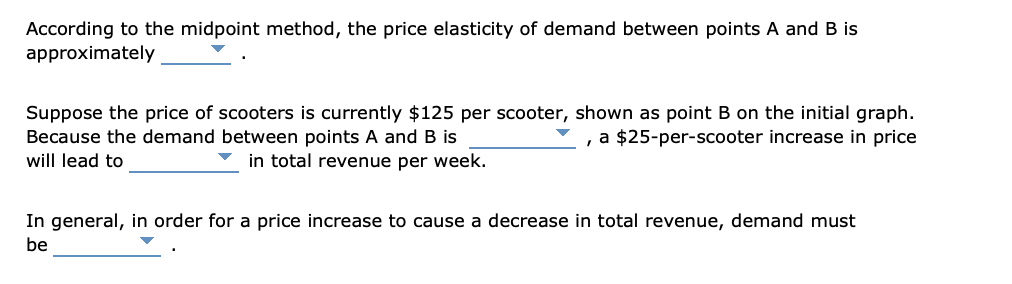
Transcribed Image Text:According to the midpoint method, the price elasticity of demand between points A and B is
approximately
Suppose the price of scooters is currently $125 per scooter, shown as point B on the initial graph.
Because the demand between points A and B is
a $25-per-scooter increase in price
will lead to
in total revenue per week.
In general, in order for a price increase to cause a decrease in total revenue, demand must
be
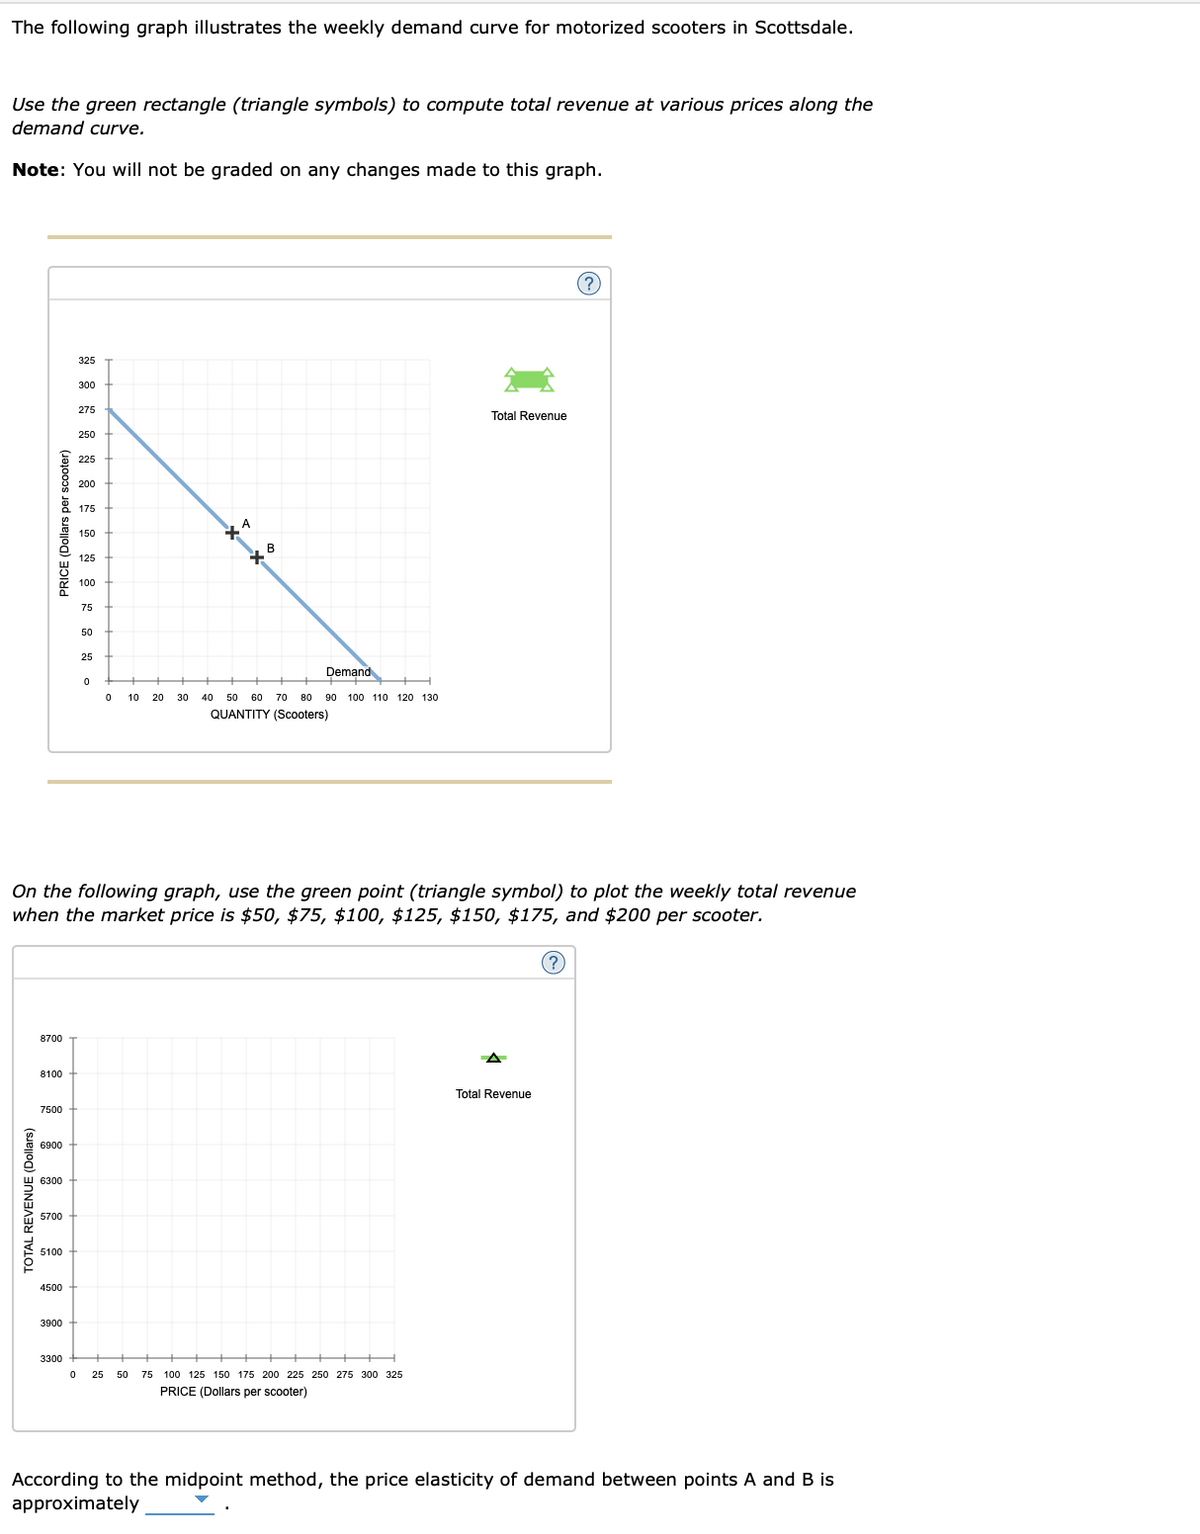
Transcribed Image Text:The following graph illustrates the weekly demand curve for motorized scooters in Scottsdale.
Use the green rectangle (triangle symbols) to compute total revenue at various prices along the
demand curve.
Note: You will not be graded on any changes made to this graph.
PRICE (Dollars per scooter)
TOTAL REVENUE (Dollars)
8700
8100
7500
6900
6300
5700
5100
4500
3900
325
3300
300
275
250
225
200
175
150
125
100
75
On the following graph, use the green point (triangle symbol) to plot the weekly total revenue
when the market price is $50, $75, $100, $125, $150, $175, and $200 per scooter.
(?)
50
25
0
0
10 20
*4
0 25 50
Xo
Demand
30 40 50 60 70 80 90 100 110 120 130
QUANTITY (Scooters)
Total Revenue
75 100 125 150 175 200 225 250 275 300 325
PRICE (Dollars per scooter)
(?)
Total Revenue
According to the midpoint method, the price elasticity of demand between points A and B is
approximately
Expert Solution
This question has been solved!
Explore an expertly crafted, step-by-step solution for a thorough understanding of key concepts.

This is a popular solution!

Trending now
This is a popular solution!

Step by step
Solved in 3 steps with 2 images

Knowledge Booster


Learn more about
Need a deep-dive on the concept behind this application? Look no further. Learn more about this topic, economics and related others by exploring similar questions and additional content below.Recommended textbooks for you

Managerial Economics: Applications, Strategies an…
Economics
ISBN:
9781305506381
Author:
James R. McGuigan, R. Charles Moyer, Frederick H.deB. Harris
Publisher:
Cengage Learning

Microeconomics: Private and Public Choice (MindTa…
Economics
ISBN:
9781305506893
Author:
James D. Gwartney, Richard L. Stroup, Russell S. Sobel, David A. Macpherson
Publisher:
Cengage Learning
Managerial Economics: Applications, Strategies an…
Economics
ISBN:
9781305506381
Author:
James R. McGuigan, R. Charles Moyer, Frederick H.deB. Harris
Publisher:
Cengage Learning
Microeconomics: Private and Public Choice (MindTa…
Economics
ISBN:
9781305506893
Author:
James D. Gwartney, Richard L. Stroup, Russell S. Sobel, David A. Macpherson
Publisher:
Cengage Learning

Economics: Private and Public Choice (MindTap Cou…
Economics
ISBN:
9781305506725
Author:
James D. Gwartney, Richard L. Stroup, Russell S. Sobel, David A. Macpherson
Publisher:
Cengage Learning

