According to the table, in which year did buyers of six-month Treasury bills receive the highest real return on their investment? 2014 2015 2016 2017 2018
According to the table, in which year did buyers of six-month Treasury bills receive the highest real return on their investment? 2014 2015 2016 2017 2018

Brief Principles of Macroeconomics (MindTap Course List)
8th Edition
ISBN:9781337091985
Author:N. Gregory Mankiw
Publisher:N. Gregory Mankiw
Chapter12: Money Growth And Intlation
Section: Chapter Questions
Problem 6PA

Related questions
Question
According to the table, in which year did buyers of six-month Treasury bills receive the highest real return on their investment?
2014
2015
2016
2017
2018
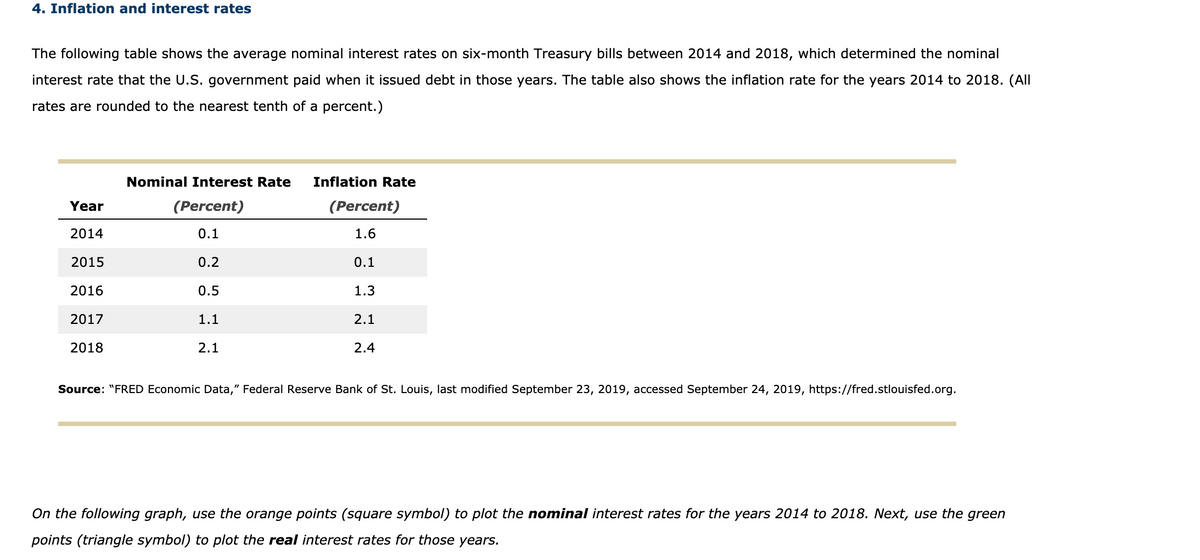
Transcribed Image Text:4. Inflation and interest rates
The following table shows the average nominal interest rates on six-month Treasury bills between 2014 and 2018, which determined the nominal
interest rate that the U.S. government paid when it issued debt in those years. The table also shows the inflation rate for the years 2014 to 2018. (All
rates are rounded to the nearest tenth of a percent.)
Nominal Interest Rate
Inflation Rate
Year
(Percent)
(Percent)
2014
0.1
1.6
2015
0.2
0.1
2016
0.5
1.3
2017
1.1
2.1
2018
2.1
2.4
Source: "FRED Economic Data," Federal Reserve Bank of St. Louis, last modified September 23, 2019, accessed September 24, 2019, https://fred.stlouisfed.org.
On the following graph, use the orange points (square symbol) to plot the nominal interest rates for the years 2014 to 2018. Next, use the green
points (triangle symbol) to plot the real interest rates for those years.
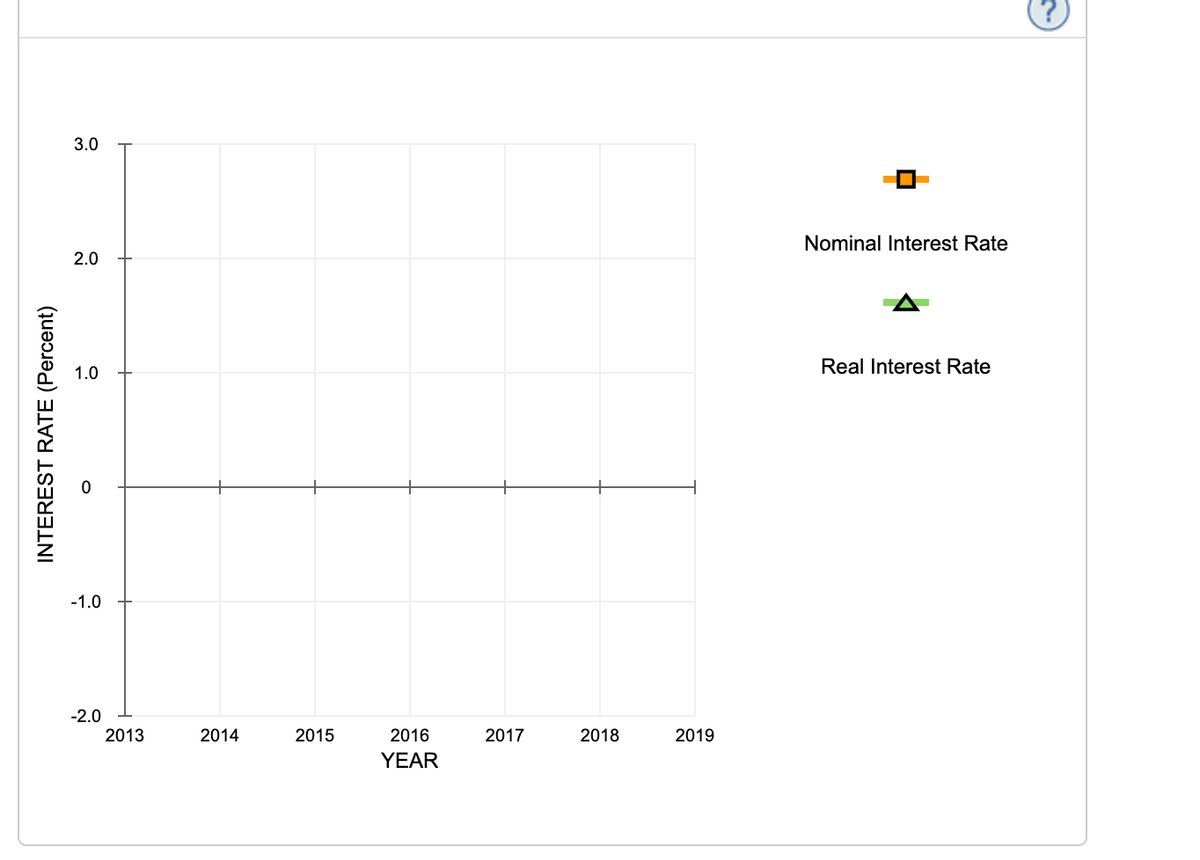
Transcribed Image Text:3.0
Nominal Interest Rate
2.0
Real Interest Rate
1.0
-1.0
-2.0
2013
2014
2015
2016
2017
2018
2019
YEAR
INTEREST RATE (Percent)
Expert Solution
This question has been solved!
Explore an expertly crafted, step-by-step solution for a thorough understanding of key concepts.

This is a popular solution!

Trending now
This is a popular solution!

Step by step
Solved in 3 steps with 1 images

Knowledge Booster


Learn more about
Need a deep-dive on the concept behind this application? Look no further. Learn more about this topic, economics and related others by exploring similar questions and additional content below.Recommended textbooks for you
Brief Principles of Macroeconomics (MindTap Cours…
Economics
ISBN:
9781337091985
Author:
N. Gregory Mankiw
Publisher:
Cengage Learning

Essentials of Economics (MindTap Course List)
Economics
ISBN:
9781337091992
Author:
N. Gregory Mankiw
Publisher:
Cengage Learning

Principles of Economics 2e
Economics
ISBN:
9781947172364
Author:
Steven A. Greenlaw; David Shapiro
Publisher:
OpenStax
Brief Principles of Macroeconomics (MindTap Cours…
Economics
ISBN:
9781337091985
Author:
N. Gregory Mankiw
Publisher:
Cengage Learning
Essentials of Economics (MindTap Course List)
Economics
ISBN:
9781337091992
Author:
N. Gregory Mankiw
Publisher:
Cengage Learning
Principles of Economics 2e
Economics
ISBN:
9781947172364
Author:
Steven A. Greenlaw; David Shapiro
Publisher:
OpenStax


Principles of Macroeconomics (MindTap Course List)
Economics
ISBN:
9781285165912
Author:
N. Gregory Mankiw
Publisher:
Cengage Learning

Principles of Economics, 7th Edition (MindTap Cou…
Economics
ISBN:
9781285165875
Author:
N. Gregory Mankiw
Publisher:
Cengage Learning