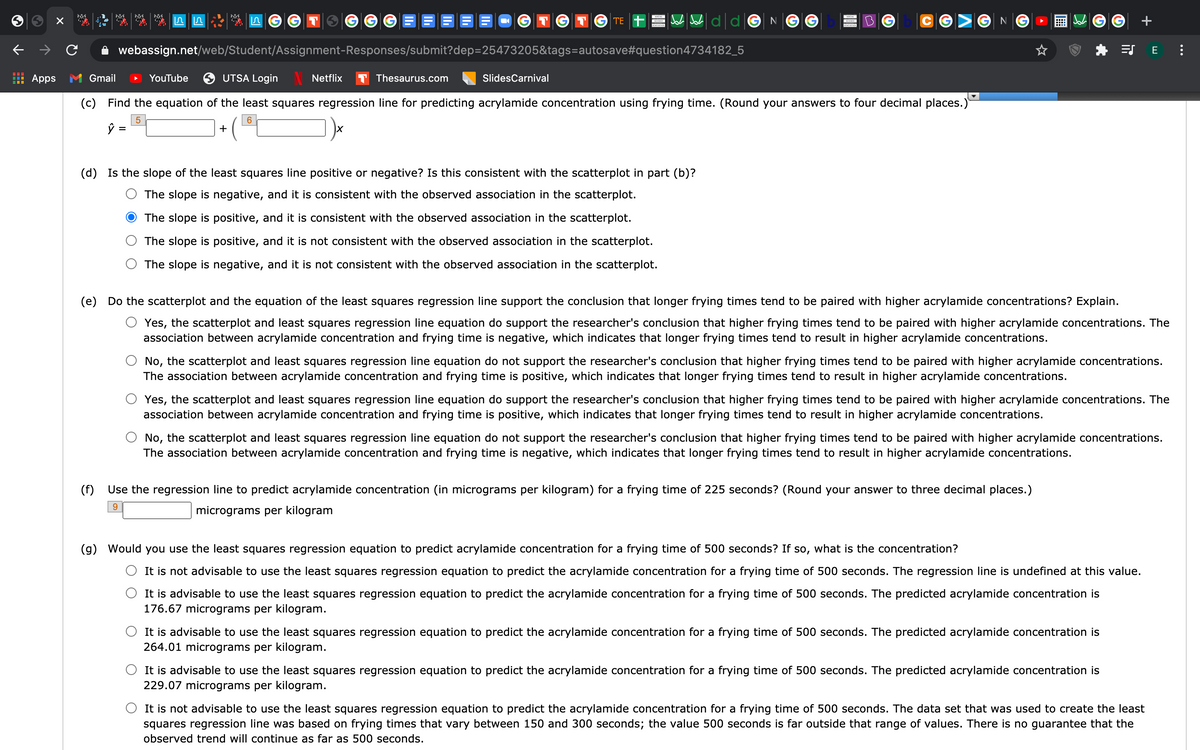
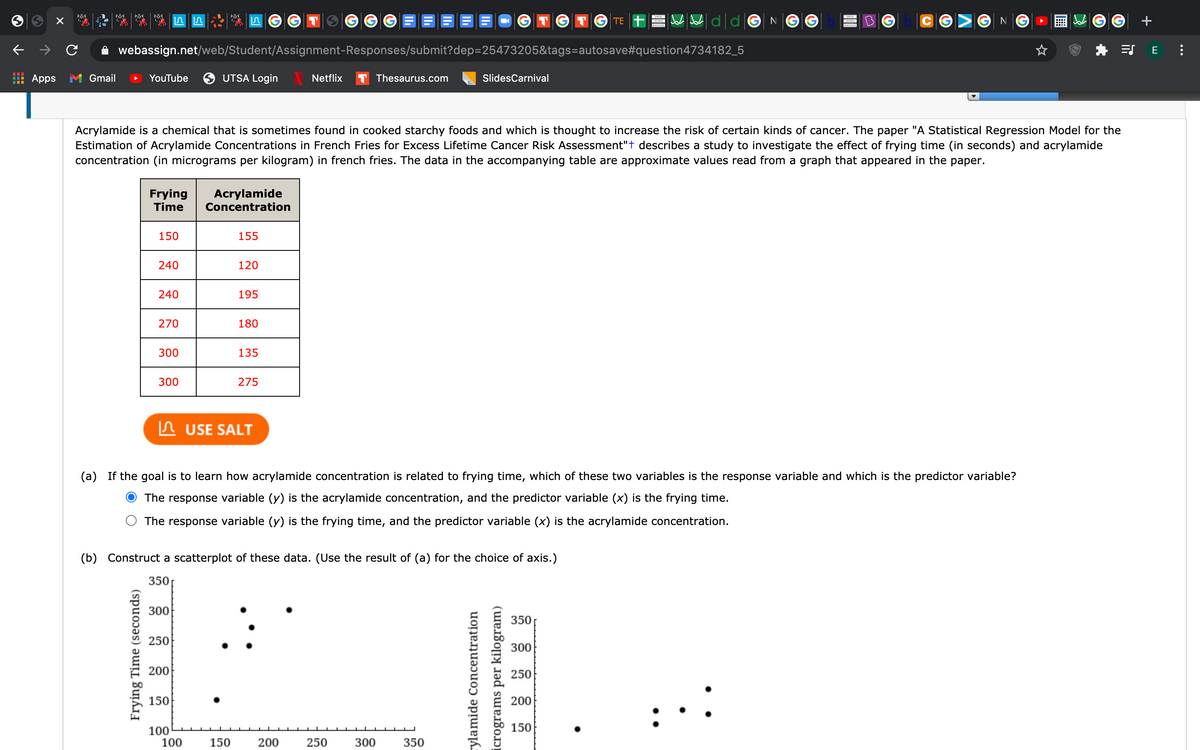
Acrylamide is a chemical that is sometimes found in cooked starchy foods and which is thought to increase the risk of certain kinds of cancer. The paper "A Statistical Regression Model for the Estimation of Acrylamide Concentrations in French Fries for Excess Lifetime Cancer Risk Assessment"t describes a study to investigate the effect of frying time (in seconds) and acrylamide concentration (in micrograms per kilogram) in french fries. The data in the accompanying table are approximate values read from a graph that appeared in the paper. Frying Time Acrylamide Concentration 150 155 240 120 240 195 270 180 300 135 300 275 A USE SALT (a) If the goal is to learn how acrylamide concentration is related to frying time, which of these two variables is the response variable and which is the predictor variable? O The response variable (y) is the acrylamide concentration, and the predictor variable (x) is the frying time. O The response variable (y) is the frying time, and the predictor variable (x) is the acrylamide concentration. (b) Construct a scatterplot of these data. (Use the result of (a) for the choice of axis.) 350 300 350 250 300 200 250 150 200 150 100 100 150 200 250 300 350 Frying Time (seconds) ylamide Concentration crograms per kilogram)


Family of Curves
A family of curves is a group of curves that are each described by a parametrization in which one or more variables are parameters. In general, the parameters have more complexity on the assembly of the curve than an ordinary linear transformation. These families appear commonly in the solution of differential equations. When a constant of integration is added, it is normally modified algebraically until it no longer replicates a plain linear transformation. The order of a differential equation depends on how many uncertain variables appear in the corresponding curve. The order of the differential equation acquired is two if two unknown variables exist in an equation belonging to this family.
XZ Plane
In order to understand XZ plane, it's helpful to understand two-dimensional and three-dimensional spaces. To plot a point on a plane, two numbers are needed, and these two numbers in the plane can be represented as an ordered pair (a,b) where a and b are real numbers and a is the horizontal coordinate and b is the vertical coordinate. This type of plane is called two-dimensional and it contains two perpendicular axes, the horizontal axis, and the vertical axis.
Euclidean Geometry
Geometry is the branch of mathematics that deals with flat surfaces like lines, angles, points, two-dimensional figures, etc. In Euclidean geometry, one studies the geometrical shapes that rely on different theorems and axioms. This (pure mathematics) geometry was introduced by the Greek mathematician Euclid, and that is why it is called Euclidean geometry. Euclid explained this in his book named 'elements'. Euclid's method in Euclidean geometry involves handling a small group of innately captivate axioms and incorporating many of these other propositions. The elements written by Euclid are the fundamentals for the study of geometry from a modern mathematical perspective. Elements comprise Euclidean theories, postulates, axioms, construction, and mathematical proofs of propositions.
Lines and Angles
In a two-dimensional plane, a line is simply a figure that joins two points. Usually, lines are used for presenting objects that are straight in shape and have minimal depth or width.
I need help on C, E, F and G
Please help if you can


Trending now
This is a popular solution!

Step by step
Solved in 2 steps with 3 images


