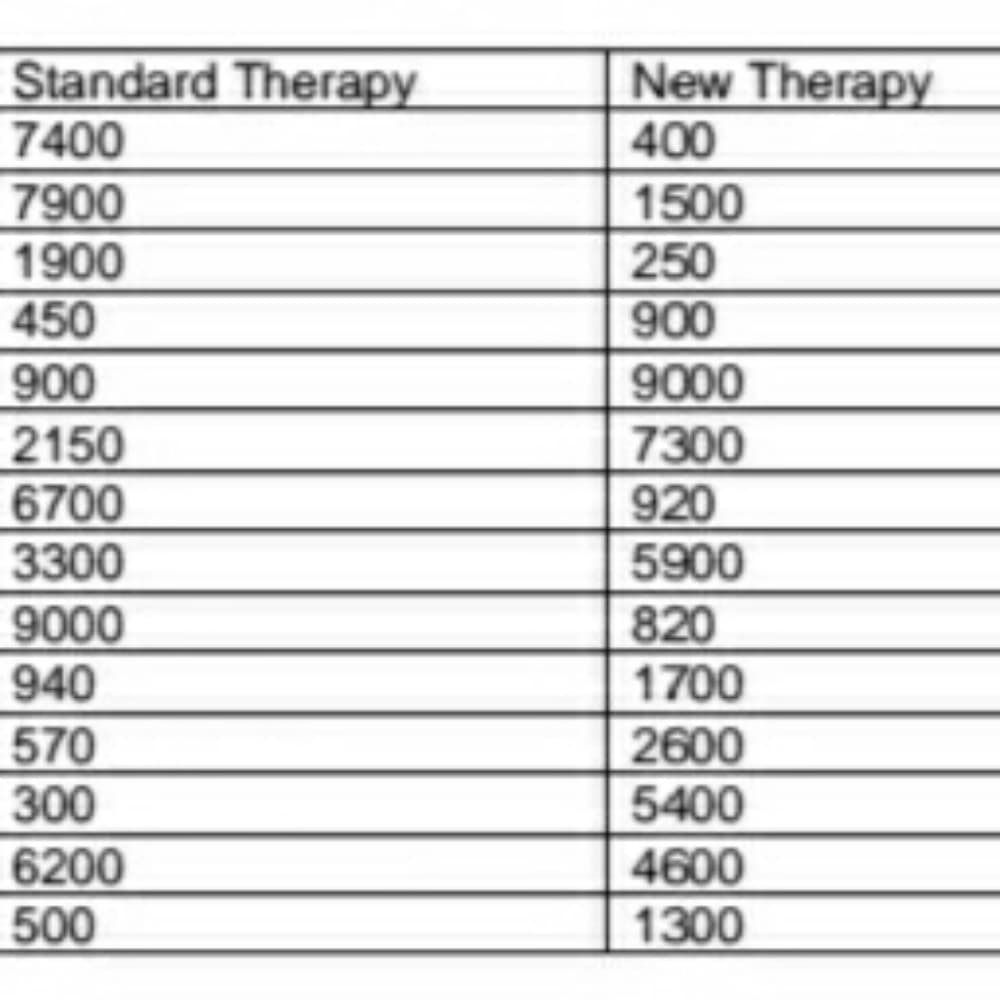
ad, or the amount of HIV copies per milliliter of blood, is the most important outcome. Is there statistical evidence of a difference in viral load in patients receiving standard versus new anti-retroviral therapy? A total of 30 participants are randomized, and the data are shown below and it is Two tailed Test


Q: With the following data in 6 cities, calculate the coefficient of correlation by Pearson’s method…
A: The provided data set is: Population in "000' Number of deaths 30 300 90 1440 40 560 42…
Q: The accompanying pie chart reports the number of hours of sleep "last night" for 119 college…
A: There are various types of graph that are constructed to visualize the data. To visualize the…
Q: A student did a survey on the age of marriage for married male and female students. Use the…
A: The table shows the age of marriage for married male and female students.
Q: Confidence Interval: You want to find a 93% confidence interval for the true proportion of…
A: Givenpopulation proportion(p)=0.06x=25n=345p^=xn=25345=0.0725Confidence level=93%
Q: In order to use a certain polymer, its firmness must be greater than 48 MPa. 14 specimens were…
A: Givenpopulation mean(μ)=48sample size(n)=14Mean(x)=48.4standard deviation(s)=1.0
Q: Assumptions of Parametric Test: (Normality of Data, homogeneity of variances, linearity, dependency)…
A: Solution-: Assumptions of Parametric Test: (Normality of Data, homogeneity of variances, linearity,…
Q: A researcher conducts a paired samples study, matching individuals in terms of age and gender, and…
A: The researcher conducts a paired samples study, matching individuals in terms of age and gender.
Q: Risk taking is an important part of investing. In order to make suitable investment decisions on…
A:
Q: )What is the shape of the data distrubution B) Find the number summary C) New york has a bachelor…
A: The given data indicates the percentages of bachelor's degree holders in 50 states in the country…
Q: A. what is the critical t-stat? Remember to use alpha = 0.05 two-tailed. B. so, is there a…
A: The objective is to conduct a repeated measures t-test to determine whether the dogs bark more often…
Q: The accompanying data represent the miles per gallon of a random sample of cars with a…
A: "Since you have a posted a question with multiple sub-parts, we'll solve the first three, to get the…
Q: Which of the following is the appropriate statement regarding logistic regression? It is selected…
A: We know that, Logistic regression is similar to linear regression. i.e. the logistic regression is…
Q: A student wishes to determine the average life-span of a household light bulb. She randomly collects…
A: Given: A student wishes to determine the average life span of a household light bulb Randomly…
Q: Confidence Interval: Aisha wants to find a 99% confidence interval for the true mean difference in…
A: Sample size(n)=145 Mean difference=$3.78 The standard deviation of the difference=$19.74
Q: Is there a relationship between one’s gender and whether one owns a dog, cat, or reptile? Use the…
A: Given the data of
Q: 2) Below is an unidentified table of values: x 78 85 92 100 85 89 93 99 100 84 y 1. What is the key…
A: x 78 85 92 100 85 y 89 93 99 100 84 Mean = ∑ixin Standard Deviation = σ = ∑i(xi-x¯)2n-1 t =…
Q: A study investigated the effectiveness of a new drug in lowering blood pressure. Subjects with mild…
A: Given Information: a) Group 1: Sample size n1=11 Sample mean x¯1=145.0 Sample standard deviation…
Q: Suppose a random sample {X}~ i.i.d.(u,02). Define the following estimator 71 2 Ĥ [jxj. n(n+1) j=1…
A: If x is consistent for µ if E(X) = µ V(x) tends to 0.
Q: You wish to compute the 95% confidence interval for the population proportion. How large a sample…
A: The provided information is α=0.05 E=0.05 The critical value is z=1.96 (from statistical table)…
Q: A supervisor at an electric bulb factory examines bulbs produced in the factory for defects. She…
A: Given problem is poisson distribution Let X: defective bulbs 14 defective bulbs in a week 1 weak = 7…
Q: 5. What conclusions can you draw from the data gathered from one small bag compared to several small…
A: Hello! As you have posted more than 3 sub parts, we are answering the first 3 sub-parts. In case…
Q: c. There are two variables here: Gender and Age. Which of them is numerical and which is…
A: Categorical variable: Categorical variables are those variables which characterize the data using…
Q: The accompanying data were collected from a statistics class. The first row gives the variable, and…
A: The given data is from a statistics class. The objective is to identify the numbers 1 and 0 for the…
Q: 7.37. U₁, U₂ are independently and uniformly generated between 0 and 1 by a machine. Let X denote…
A: Given that: U1 and U2~Uniform0,1 Sum, X=U1+U2 Let Y = 1- U2
Q: The data in the accompanying table were collected from a statistics class. The first row gives the…
A: Given : The data table includes following var. : Female, Commute distance, Hair color, Ring size,…
Q: Suppose in a certain state there were 40 tornadoes in the last 25 years. Using the Poisson…
A:
Q: The Credit Risk Department of a major bank estimates the default rate on loans under $10,000 to be…
A:
Q: a. What is the probability that Harriet misses for the first time on her 10th shot? b. What is the…
A: here given , Harriet , a basket ball player can score from the 3-point line with probability 87% p…
Q: A sample of students were questioned to determine how much they would be willing to pay to see a…
A: Stacking: A data gathering is segmented into subcategories, and the components are integrated by an…
Q: 8. Which of the follow is NOT an assumption of the independent samples t-test? Group of answer…
A: To find: Which of the follow is NOT an assumption of the independent samples t-test?
Q: single factor design and an example of a factorial design. Provide the independent variable (IV)…
A: The basic principle of the Analysis of variance is to test the difference among the means of the…
Q: For the Hawkins Company, the monthly percentages of all shipments received on time over the past 12…
A: The given data is: .
Q: 1. Find the precision value of X7 and X8? No X₂ 98 101 102 97 101 100 103 98 106 99 1234 1 2 3 4 5 6…
A: Observation error of two types, they are accuracy and precision. Precision is the measurement which…
Q: Given the population 80, 85, 95, 90, 94, 96, 98 and a sample size of six, create a frequency and…
A: Given data is 80,85,95,90,94,96,98.
Q: Example. Given the joint density f(x,y)=Ę(2x+3y),0<xy≤1. of X and Y representing the proportions of…
A: Given the joint pdf is, f(x,y)=25(2x+3y),0≤x,y⩽1 The conditional density function of X given Y is…
Q: A very silly person trains their dogs to bark any time they hear an Olivia Rodrigo song or a Juic…
A: Given that
Q: b. The sample variance is an unbiased estimator of the population variance Is S² the MVUE of o2?…
A: b)Given that S2 is an unbiased estimator of population variance σ2.i.e., E( S2)=σ2Given that, Sample…
Q: Test the hypothesis using the P-value approach. Be sure to verify the requirements of the test. Ho:…
A:
Q: suppose that IQ scores in one region are normally distributed with a standard deviation of 18 .…
A: Given Standard deviations=18
Q: which is more appropriate if the sample size is more than 50? Kolmogorov test or Shapiro test?
A:
Q: How do you calculate the upper quartile when you have missing data in the column age in the dataset…
A:
Q: Alcohol probabilities. Data collected by the Substance Abuse and Mental Health Services…
A:
Q: Let the 2-dimensional random variables (X, Y) have joint uniform density function f(x,y) = ²,0≤x≤3,…
A: Since we only answer up to 3 sub-parts, we’ll answer the first 3. Please resubmit the question and…
Q: An environmentalist wants to find out the fraction of oil tankers that have spills each month.…
A:
Q: raw the trend line, if there is, for each scatterplot. b. C. P etermine the strength of the value of…
A: For the given values of correlation coefficient, We have to tell strength of correlation. + shows (…
Q: 4. The specification of the melting point of an alloy is 1200 degrees Celsius. If the melting point…
A: Formula : Test statistic
Q: Jamaica Auto Service is a popular place for car service. It is also known that the mean time taken…
A: From the provided information, Mean (µ) = 15 Standard deviation (σ) = 2.5
Q: Relevant Relationship: There is a functional relationship between Price of an IPod Touch,p and…
A: Given data: Price (p) Weekly Demand (s) 150 210 170 203 190 199 210 183 230 185 250…
Q: For a non-parametric between sample analysis, you use: A. Wilcoxon B. Paired t-test C. Mann…
A: The objective is to identify the non-parametric test between two samples:
Q: A researcher wants to determine if a new treatment is effective for reducing Ebola-related fever.…
A: The researcher is interested in examining the effectiveness of a new treatment in reducing…
A clinical trial is being conducted to determine the efficacy of a novel antiretroviral medication for HIV patients. Patients are randomized to receive either standard antiretroviral therapy or the novel antiretroviral therapy and are followed for three months. The viral load, or the amount of HIV copies per milliliter of blood, is the most important outcome. Is there statistical evidence of a difference in viral load in patients receiving standard versus new anti-retroviral therapy? A total of 30 participants are randomized, and the data are shown below and it is Two tailed Test

Step by step
Solved in 3 steps

- Restaurant X Restaurant Y89 101121 125116 153143 117270 171183 134122 114151 122158 127210 129335 137305 140181 227116 216161 291152 12595 95238 136243 242189 146155 148196 201168 149123 14262 141198 143182 154117 139139 169169 138185 244198 234236 248192 237352 234304 165213 85192 110183 58184 172107 79143 147175 138157 99173 131155 150170 127127 185136 145306 132 Refer to the accompanying data set of mean drive-through service times at dinner in seconds at two fast food restaurants. Construct a 95% confidence interval estimate of the mean drive-through service time for Restaurant X at dinner; then do the same for Restaurant Y. Compare the results. Construct a 95% confidence interval of the mean drive-through service times at dinner for Restaurant X.Strength 41.16870 42.74848 41.22397 40.17116 40.83175 40.67846 40.82867 43.63294 42.91005 40.09211 43.75882 40.56935 40.82096 38.84432 36.94097 39.02378 37.96108 43.91082 41.68559 37.84413 40.35797 42.61224 37.94146 36.83174 39.74234 37.26257 45.7178 37.60587 43.28438 38.16735 41.63766 42.71233 41.87934 44.79284 40.87075Price SqFt 600000 2767 545000 2731 314900 2051 419000 2084 365000 2270 479000 1950 323000 1235 339900 2116 399000 1644 552000 2415 223017 1375 315777 1529 499000 2223 575000 2327 342000 1879 375000 1558 349000 2012 485000 1200 549888 1410 295000 1943 399000 1827 306999 1840 265200 1636 479000 2357 249700 1152 539500 2650 365000 2154 295900 1279 499000 2156 526000 2493 514900 2390 346000 1347 460000 2120 389000 1917 499000 1200 405000 2643 389900 1789 545000 2327 339000 1742 425000 1746 479000 1421 392000 2569 Interpret b0 in the context of this problem. Interpret b1 in the context of this problem. What percent of total variation in prices is explained by the regression model? Provide evidence to support your answer. Please include the excel function.
- NORTH–SOUTH AIRLINE CASENorthern Airline DataAirframe CostEngine CostAverage AgeYearper Aircraftper Aircraft(Hours)200151.8043.496,512200254.9238.588,404200369.7051.4811,077200468.9058.7211,717200563.7245.4713,2752006 84.7350.2615,215200778.7479.6018,390Southeast Airline DataAirframe CostEngine CostAverage AgeYearPer Aircraftper Aircraft(Hours)200113.2918.865,107200225.1531.558,145200332.1840.437,360200431.7822.105,773200525.3419.697,150200632.7832.589,364200735.5638.078,2591. Develop Regression equations for each cost category as dependent variables and average age as independent variables. Do this for each Airline. Look at graphs produced by QM2. From the regression results, what would you conclude about a) airframe vs engine costs for each airlineb) comparing airlines as to airframe costsc) comparing airlines as to engine costsd) Provide a brief summary report of your comparisons0.7200.7400.6400.3900.7002.2001.9800.6401.2200.2001.6401.3402.9500.9001.7601.0101.2600.0000.6501.4601.6201.8300.9901.5600.4101.2800.8301.3200.5401.2500.9201.0000.7800.7901.4401.0002.2402.5001.7901.2501.4900.8401.4201.0001.2501.4201.3500.9300.4001.390 The accompanying data table lists the magnitudes of 50 earthquakes measured on the Richter scale. Test the claim that the population of earthquakes has a mean magnitude greater than 1.00. Use a 0.01significance level. Identify the null hypothesis, alternative hypothesis, test statistic, P-value, and conclusion for the test. Assume this is a simple random sample the sample data is above. What are the hypotheses? A. H0: μ=1.00 in magnitude H1: μ≠1.00 in magnitude B. H0: μ=1.00 in magnitude H1: μ<1.00 in magnitude C. H0: μ=1.00 in magnitude H1: μ>1.00 in magnitude D. H0: μ≠1.00 in magnitude H1: μ=1.00 in magnitude Identify the test statistic. t= (Round to two decimal places as…Easy to graduate colleges Tough to graduate colleges 547 495 550 526 451 480 470 533 617 429 554 529 524 568 620 550 650 535 519 506 486 540 494 509 513 459 615 526 524 377 525 543 608 490 537 513 550 466 520 544 540 502 497 480 520 531 533 470 455 400 525 494 603 395 578 445 459 460 525 372 575 504 564 480 509 520 530 542 670 522 590 440 590 510 532 419 585 330 514 457 592 436 485 433 660 426 470 433 408 440 505 455 557 486 650 399 538 508 515 488 536 436 515 393 560 439 560 642 557 524 617 570 470 528 462 544 570 532 541 508 422 538 579 515 575 450 564 550 540 685 600 742 571 550 660 610 550 498 526 469 530 575 555 435 520 550 482 570 444 650 687 530 482 432 514 508 442 480…
- Hours Spent in Child Care 7.5 1.8 0.9 8.0 5.2 6.1 3.3 1.0 4.4 1.6 5.2 11.5 11.6 10.1 9.0 7.3 2.2 1.0 5.2 10.7 7.6 4.1 10.1 6.0 10.1 9.9 10.4 7.0 3.8 9.6 4.1 7.2 4.0 8.5 6.0 7.3 5.4 11.5 9.1 6.5Earnings and Height Earnings Height Sex 84004.75 59 0 84075.75 59 0 7822.854004 59 0 84110.75 59 0 84098.75 60 0 44138.16016 60 0 17116.26367 60 0 84070.75 60 0 84058.75 60 0 84089.75 60 0 38917.33594 60 0 33729.96875 60 0 44165.16016 61 0 33715.96875 61 0 49407.10938 61 0 84118.75 61 0 33613.96875 61 0 28509.38672 61 0 44145.16016 61 0 84033.75 61 0 44218.16016 61 0 33661.96875 61 0 84025.75 61 0 84117.75 61 0 28601.38672 61 0 33784.96875 61 0 49462.10938 61 0 33632.96875 62 0 18198.8418 62 0 44153.16016 62 0 83967.75 62 0 83994.75 62 0 44121.16016 62 0 83961.75 62 0 10807.42871 62 0 83980.75 62 0 23410.87305 62 0 38952.33594 62 0 84014.75 62 0 83979.75 62 0 84043.75 62 0 23369.87305 62 0 44170.16016 62 0 84056.75 62 0 44205.16016 62 0 84100.75 62 0 84116.75 62 0 23388.87305 62 0 23400.87305 63 0 49370.10938 63 0 9938.505859 67 1 84063.75 67 1 23422.87305 67 1 38867.33594…Price Age Mileage13590 6 6148513775 6 5434422991 1 824615303 4 2485616388 3 2210016600 3 2370216987 4 4740118489 2 1688818859 3 3538019857 3 2963411877 9 5579214989 3 4618315900 3 3700916500 4 455219440 9 8690212988 5 7724115777 6 5964710490 9 932418938 10 4822111988 8 42408 The accompanying table shows a portion of data consisting of the price, the age, and the mileage for 20 used sedans. Price Age Mileage 13590 6 61485 13775 6 54344 ⋮ ⋮ ⋮ 11988 8 42408 Determine the sample regression equation that enables us to predict the price of a sedan on the basis of its age and mileage. (Negative values should be indicated by a minus sign. Round your answers to 2 decimal places.) [If you are using R to obtain the output, then first enter the following command at the prompt: options(scipen=10). This will ensure that the output is not in scientific…
- Banking Retail Insurance 12 8 10 10 8 8 10 6 6 12 8 8 10 10 10Crime for 2019 728 294 43,836 46 16,251 6,345 21,678 62,977 65 10,519 19 405 44 1,056 69,062 10,868 4,807 203 2,519 3,877 409 4,848 4,038 Crime for 2020 252 539 48,462 63 16,400 4,148 23,816 54,932 81 9,522 13 640 27 1,182 63,720 12,451 2,465 98 2,897 3,651 306 5,004 3,659 Crime for 2011 426 26,978 67 22,028 8,924 18,634 35,665 0 27 7,100 10 223 459 55,765 4,400 2,590 112 1,774 8,033 550 3,401 1,723Expenses MSA Expenses Regular Health MSA Health Regular 413.92 597.83 2 2 150.55 353.84 1 1 287.26 540.03 1 1 609.82 551.42 2 2 358.9 620.41 2 1 317.87 507.36 1 1 415.75 507.05 2 1 256.73 673.14 2 1 429.24 525.77 1 1 0 333.1 2 2 429.23 383.78 1 1 598.42 616.68 1 1 424.7 460.88 1 1 293.94 223.27 1 1 25.5 559.87 1 1 481.93 579.1 1 1 347.73 447.95 1 1 235.12 476.57 1 1 353.91 408.15 1 2 197.22 397.14 1 1 125.61 415.49 1 1 376.86 517.23 1 2 337.36 404.87 1 1 481.22 639.35 1 1 367.8 454.03 1 2 164.3 289.86 2 1 330.54 546.59 1 1 338.36 361.42 1 1 187.62 518.18 2 2 292.97 561.44 1 1 384.85 482.4 1 1 286.55 361.51 1 1 566.91 658.18 2 2 225.1 590.34 2 1 148.96 584.15 1 1 373.36 665.71 1 1 168.28 468.04 1 1 281.64 247.68 1 1 555.2 331.35 1 1 354.1 391.79 1 1 409.97 433.39 1 1 605.43 403.15 1 1 440.25 416.28 2 1 513.88 645.89 1 1 348.7 820.4 1 2 431.81 682.14 1 1 205.47 254.64 1 1 304.87 627.84 1 1…