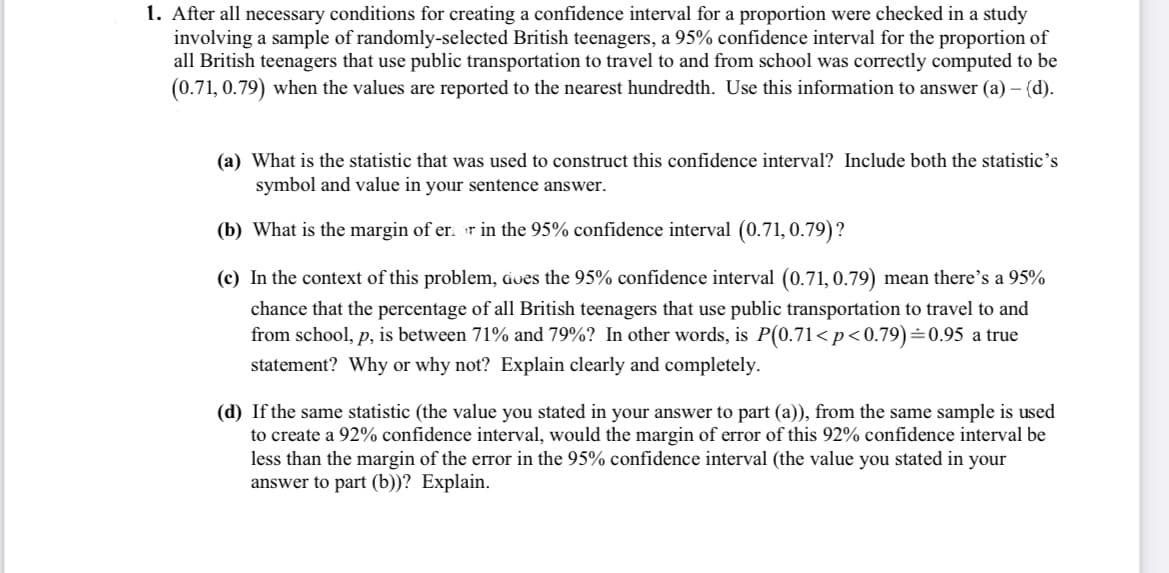
After all necessary conditions for creating a confidence interval for a proportion were checked in a study involving a sample of randomly-selected British teenagers, a 95% confidence interval for the proportion of all British teenagers that use public transportation to travel to and from school was correctly computed to be (0.71, 0.79) when the values are reported to the nearest hundredth. Use this information to answer (a) - (d). (a) What is the statistic that was used to construct this confidence interval? Include both the statistic's symbol and value in your sentence answer. (b) What is the margin of er. r in the 95% confidence interval (0.71, 0.79)?


Contingency Table
A contingency table can be defined as the visual representation of the relationship between two or more categorical variables that can be evaluated and registered. It is a categorical version of the scatterplot, which is used to investigate the linear relationship between two variables. A contingency table is indeed a type of frequency distribution table that displays two variables at the same time.
Binomial Distribution
Binomial is an algebraic expression of the sum or the difference of two terms. Before knowing about binomial distribution, we must know about the binomial theorem.
Please show all the work correctly and support all the answers with correct evidence. This just 1 equation with sub-parts.


Trending now
This is a popular solution!

Step by step
Solved in 4 steps with 1 images


