age distribution of the Canadian population and the age distribution of a random sample of 455 residents in the Indian community of a village are shown below. Observed Number in the Village Age (years) Under 5 5 to 14 15 to 64 65 and older USE SALT Percent of Canadian Population 7.2% 13.6% State the null and alternate hypotheses. O Ho: The distributions are the same. H₁: The distributions are different. O Ho: The distributions are different. H₁: The distributions are the same. O Ho: The distributions are different. H₁: The distributions are different. a 5% level of significance to test the claim that the age distribution of the general Canadian population fits the age distribution of the residents of Red Lake Village. (a) What is the level of significance? Ho: The distributions are the same. H₁: The distributions are the same. 67.1% 12.1% (b) Find the value of the chi-square statistic for the sample. (Round your answer to three decimal places.) Are all the expected frequencies greater than 5? O Yes O No What sampling distribution will you use? O uniform chi-square binomial Student's t 46 80 283 46
age distribution of the Canadian population and the age distribution of a random sample of 455 residents in the Indian community of a village are shown below. Observed Number in the Village Age (years) Under 5 5 to 14 15 to 64 65 and older USE SALT Percent of Canadian Population 7.2% 13.6% State the null and alternate hypotheses. O Ho: The distributions are the same. H₁: The distributions are different. O Ho: The distributions are different. H₁: The distributions are the same. O Ho: The distributions are different. H₁: The distributions are different. a 5% level of significance to test the claim that the age distribution of the general Canadian population fits the age distribution of the residents of Red Lake Village. (a) What is the level of significance? Ho: The distributions are the same. H₁: The distributions are the same. 67.1% 12.1% (b) Find the value of the chi-square statistic for the sample. (Round your answer to three decimal places.) Are all the expected frequencies greater than 5? O Yes O No What sampling distribution will you use? O uniform chi-square binomial Student's t 46 80 283 46

Glencoe Algebra 1, Student Edition, 9780079039897, 0079039898, 2018
18th Edition
ISBN:9780079039897
Author:Carter
Publisher:Carter
Chapter10: Statistics
Section10.4: Distributions Of Data
Problem 19PFA

Related questions
Question
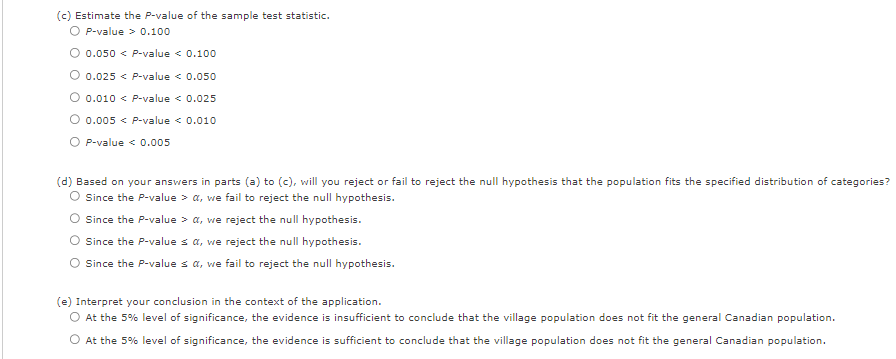
Transcribed Image Text:(c) Estimate the P-value of the sample test statistic.
OP-value > 0.100
O 0.050 < P-value < 0.100
0.025 < P-value < 0.050
O 0.010 < P-value < 0.025
O 0.005 < P-value < 0.010
OP-value < 0.005
(d) Based on your answers in parts (a) to (c), will you reject or fail to reject the null hypothesis that the population fits the specified distribution of categories?
O Since the P-value > a, we fail to reject the null hypothesis.
Since the P-value > α, we reject the null hypothesis.
Since the P-values a, we reject the null hypothesis.
Since the P-values a, we fail to reject the null hypothesis.
(e) Interpret your conclusion in the context of the application.
O At the 5% level of significance, the evidence is insufficient to conclude that the village population does not fit the general Canadian population.
O At the 5% level of significance, the evidence is sufficient to conclude that the village population does not fit the general Canadian population.
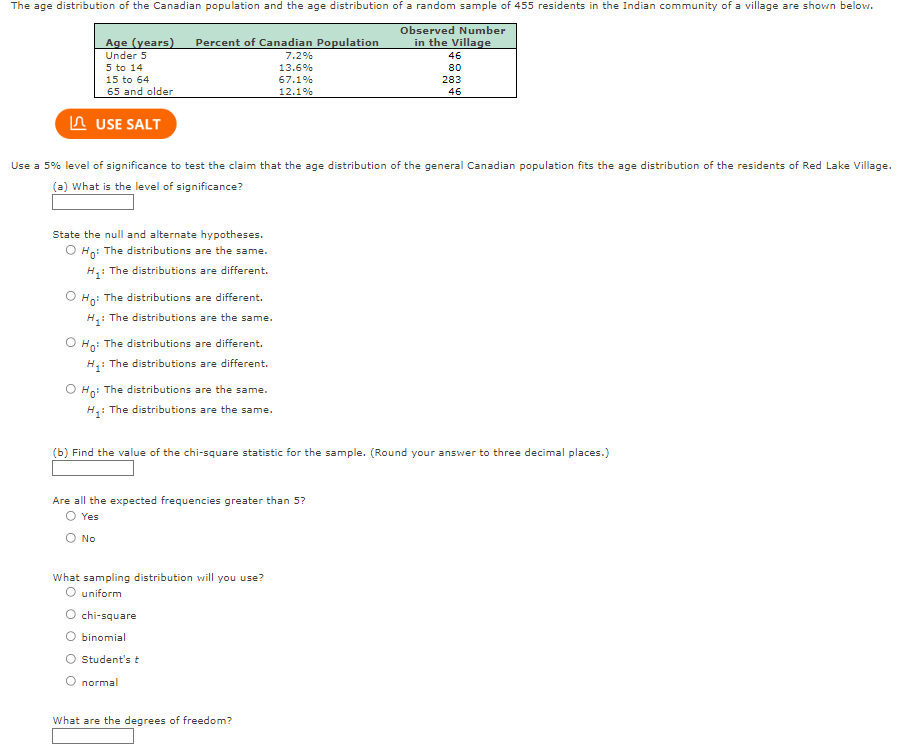
Transcribed Image Text:The age distribution of the Canadian population and the age distribution of a random sample of 455 residents in the Indian community of a village are shown below.
Observed Number
in the Village
Age (years)
Under 5
5 to 14
15 to 64
65 and older
USE SALT
Percent of Canadian Population
7.2%
13.6%
67.1%
12.1%
Use a 5% level of significance to test the claim that the age distribution of the general Canadian population fits the age distribution of the residents of Red Lake Village.
(a) What is the level of significance?
State the null and alternate hypotheses.
Ho: The distributions are the same.
H₁: The distributions are different.
O
Ho: The distributions are different.
H₁: The distributions are the same.
O Ho: The distributions are different.
H₁: The distributions are different.
O Ho: The distributions are the same.
H₁: The distributions are the same.
(b) Find the value of the chi-square statistic for the sample. (Round your answer to three decimal places.)
Are all the expected frequencies greater than 5?
Yes
O No
46
80
283
46
What sampling distribution will you use?
O uniform
O chi-square
binomial
Student's t
normal
What are the degrees of freedom?
Expert Solution
This question has been solved!
Explore an expertly crafted, step-by-step solution for a thorough understanding of key concepts.

This is a popular solution!

Trending now
This is a popular solution!

Step by step
Solved in 2 steps with 2 images

Recommended textbooks for you
Glencoe Algebra 1, Student Edition, 9780079039897…
Algebra
ISBN:
9780079039897
Author:
Carter
Publisher:
McGraw Hill
Glencoe Algebra 1, Student Edition, 9780079039897…
Algebra
ISBN:
9780079039897
Author:
Carter
Publisher:
McGraw Hill