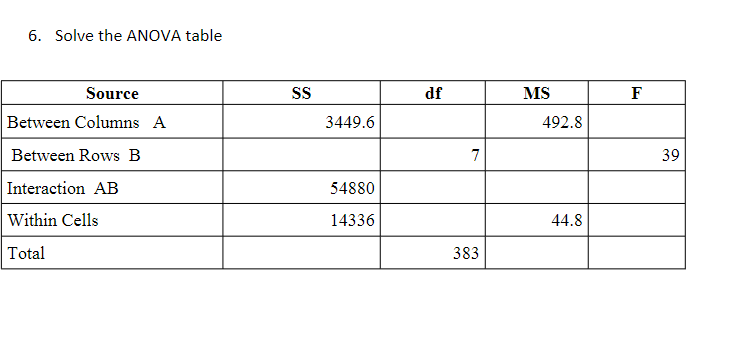
6. Solve the ANOVA table Source Between Columns A Between Rows B Interaction AB Within Cells Total SS 3449.6 54880 14336 df 7 383 MS 492.8 44.8 F 39


Q: (b) Perform a Z-test and find the p-value. Here is some information to help you with your Z-test. •…
A:
Q: e Acme Company manufactures widgets. The distribution of widget weights is bell-shaped dget weights…
A: Given Mean=46 Standard deviation=7
Q: 3. Rewrite the following expression in the form of lag polynomial. [Show steps] +0.4€1-2 (a) y = 1.5…
A:
Q: When Ann drives to school, she only passes one intersection with a stoplight. Based on her previous…
A: given data P(green or yellow) = 0.70 P(red) = 1 - 0.70 = 0.30 drives to school for 5 days.…
Q: Telephone Calls A researcher knew that before cell phones, a person made on average 2.5 calls per…
A: The sample size is 32, sample mean is 2.8, population standard deviation is 0.6.
Q: In a regression, p value of an effect is 0.001, less than the level of significance (alpha = 0.05).…
A: Given: Pvalue is = 0.001 and level of significance=0.05 Then this means that?
Q: Refer to the accompanying data display that results from a sample of airport data speeds in Mbps.…
A: We have given that Confidence interval = (13.046,22.15) Sx = 16.01712719 Sample mean (x̅) = 17.598…
Q: The coefficient of determination indicates that ________.
A: Here we have given, SSR = 555420 SSE = 1962873 SST = 2518293 We have to find the coefficient of…
Q: There are four brothers in a family. Their ages are 7 years,10 years,15 years, and 21 years.…
A: From the provided information, Sample size (n) = 4 The data values are as follow: 7, 10, 15, 21
Q: (a) Construct a 95% confidence interval about µ if the sample size, n, is 34. Lower bound:; Upper…
A: It is given that Sample mean = 18.9 Sample standard deviation = 4.3 Note: According to Bartleby…
Q: Ages of Proofreaders At a large publishing company, the mean age of proofreaders is 36.2 years and…
A: given data normal distributionμ = 36.2σ = 3.7P(35<x<36.5) = ?
Q: Tellers in the Southeast Region and determined that their mean training time was 25 hours. Assume…
A: GivenMean(μ)=25standard deviation(σ)=5confidence level=92%
Q: A package contains 12 resistors, 2 of which are defective. If s are selected, find the probability…
A: GIVEN DATA, 02- defective 10- non- defective 12- resisrors5 are selected p(one defective)=?
Q: The diameter of ball bearings produced in a manufacturing process can be explained using a uniform…
A:
Q: Test the claim about the population mean, μ, at the given level of significance using the given…
A: Solution-: Given: x¯=38.5, n=53, σ=3.96, α=0.05, μ0=40(Claim) We want to identify the null and…
Q: 1. Which among the players had the highest score and how many runs did he made?
A: Here we have given the pie chart that shows the percentage of runs scored by the each player. Here…
Q: = 30 The testing times for a group of college students were normally distributed with a mean of μ…
A: Given Mean=30 Standard deviations=4.7
Q: To test Ho: μ = 100 versus H₁: μ#100, a simple random sample size of n = 22 is obtained from a…
A: It is given that Sample size n = 22 Sample mean M = 104.6 Sample SD s = 9.6 Level of significance =…
Q: Below is a graph of a normal distribution with mean μ = -2 and standard deviation = 2. The shaded…
A: Given data: Population Mean = -2 Population standard deviation = 2
Q: Use the data given to test the following hypotheses. Assume the data are normally distributed in the…
A: Given data: Significance level = 0.01
Q: Let p equal the proportion of athletes who suffered a training-related overuse injury during the…
A: Given X=167, n=sample size=330
Q: A machine that paints traffic stripes on roads is mounted on a truck and set to a width of 4 inches.…
A:
Q: essica counts how many customers have come into her restaurant for the past 30 days. The table…
A: The objective is to construct a histogram starting at 130 with a bin width of 5.
Q: The following data represents the level of health and the level of education for a random sample of…
A: From given data we have Education Excellent Good Fair Poor Not a H.S. graduate 149 152 85…
Q: 28. A random variable X has a bell-shaped symmetric distribu- tion, with expected value = 100 and…
A: GIVEN DATA bell shaped distribution μ = 100σ = 30
Q: 3. A psychology professor wants to know if stress in his statistics class is in anyway affected by a…
A: Given Following notations can be assumed: Psychology=A Other=B Male=1 17,-1,9,17,10,13,13,14…
Q: The following data was obtained from a CRD with 5 treatments and 4 replications per treatment DATA:…
A: 1) Type data in excel A B C D E 23.9 59 26.6 48.4 22.6 43.3 27.3 46.8 48.6 54 45.7 27 33.1…
Q: The least-squares regression equation is y=649.1x + 16,025 where y is the median income and x is the…
A: From given data regression equation is y^=649.1x+16025
Q: 30 tickets are sold and three prizes are to be awarded, find the probability that one person will…
A: Given Total tickets=30
Q: There are four brothers in a family. Their ages are 7 years,10 years,15 years, and 21 years.…
A: From the provided information, Population size (n) = 4 The ages are 7 years,10 years,15 years, and…
Q: Determine the expected count for each outcome using the table provided: n=875 i 1 2 3 4 Pi 0.16 0.35…
A:
Q: The coefficient of variation (CV%) is a normalized measure of the dispersion of a distribution. It…
A: given data ∑x = 61.2∑x2 = 444.6n = 16cv% = ?
Q: Problem 1) The cumulative distribution function of random variable X is: 0 x 1/2]. b) Find P[-1/2 <…
A: Hi! Thank you for the question, As per the guidelines, we are allowed to answer one question at a…
Q: A survey of 100 people in the Metropolitan Region indicated that 56% of them need credit to complete…
A:
Q: Use the bar chart below to summarize the data in the form of frequency and relative frequency.…
A: Given information, Use the bar chart below to summarize the data in the form of frequency and…
Q: 21. A couple has three children; X = the number of girls. (Assume an equal likelihood of a child…
A:
Q: The mean height of Grade III pupils is 138 cm with a standard deviation of 8 cm. If a sample of 30…
A: given data μ = 138σ = 8n = 30P(x¯ ≥140) = ?
Q: High School Dropouts Approximately 10.7% of American high school students drop out of school before…
A: given data P(drop out) = 0.107 ∴ P(stay in school and graduate) = 1-0.107 = 0.893 sample size…
Q: Assume that the probability of the binomial random variable will be approximated using the normal…
A: Let X follows Binomial distribution. We have to compute the probability that X = 4 I.e P(X = 4).
Q: Suppose the following table was generated from a sample of 20 CEOs relating annual salary to years…
A: Regression equation is used to predict the values. If it has only one independent variable, then it…
Q: A certain pen has been designed so that true average writing lifetime under controlled conditions…
A: given data H0 : μ = 10Ha : μ < 10 we reject Ho if p value < α. n = 17 df = n-1 = 17-1 = 16
Q: High School Dropouts Approximately 10.7% of American high school students drop out of school before…
A: P(drop out) = 0.107 ∴P(graduate) = 1 - 0.107 = 0.893 sample size n = 12 x = no. of people graduates…
Q: A simple random sample of size n=76 is obtained from a population with μ = 60 and o=2. Does the…
A: Given Sample size n=76 population mean and standard deviation μ=60, =2
Q: A magazine tested LCD televisions. The table below shows the overall quality score and cost in…
A: Given that Quality 75 74 71 70 66 65 64 60 60 57 56 Cost 26 29 37 22 21 10 26 22 11 10 21 We…
Q: Calculate the correlation coefficient, r, for the data below. 0 y - 19 X 29 6 4 17 0 -8 -11 O A.…
A: Given data is x y 0 -19 2 -17 9 0 6 -8 4 -11 3 -15 5 -10 7 -6 8 -3 1 -17
Q: a reading test. Shaylen's score of 455 was higher than the scores of 4276 of the 7212 students who…
A: Given a reading test, Shaylan's score of 455 was higher than the scores of 4276 of the 7212 students…
Q: 15. Does learning a second language change brain structure? Mechelli et al. (2004) tested 22 native…
A: Correlation is employed to check the linear association or correspondence between the mentioned…
Q: 38) The heights (in inches) of 20 randomly selected adult males are listed below. Test the claim…
A: Given The variance is less than 6.25 Sample size (n) =20 Enter the given data into Excel And…
Q: Calculate the direct labor productivity based on the following criteria: Actual Hours worked…
A:
Q: 34) Test the claim that o2 47.6 if n = 10, s² = 52.5, and a = 0.01. Assume that the population is…
A: The null and alternative hypotheses are: H0:σ2=47.6 H1:σ2≠47.6
Please answer and exmaplin, would really appricate it


Trending now
This is a popular solution!

Step by step
Solved in 2 steps with 2 images

- Show the sample space of the experiment: toss a fair coin three times.A community college employs 87 full-time faculty members. To gain the faculty's opinions about an upcoming building project, the college president wishes to obtain a simple random sample that will consist of 9 faculty members. He numbers the faculty from 1 to 87. Complete parts (a) and (b) below. Random NumbersRow Column Numberrow # 01–05 06–10 11–15 16–2001 - 3 8 3 9 4 1 6 1 1 0 9 4 0 6 2 5 1 0 2 502 - 3 2 9 2 6 6 4 4 4 3 1 7 3 6 2 6 9 5 4 803 - 9 1 8 4 6 9 8 1 3 7 7 4 4 0 9 1 5 9 7 804 - 5 6 9 4 7 1 0 0 7 9 3 9 8 2 9 0 5 6 4 905 - 3 2 2 4 5 8 1 9 0 8 9 5 8 4 9 3 7 7 3 106 - 0 4 9 3 3 9 1 6 7 3 3 7 0 6 0 1 8 5 6 3 Using the provided random number table, the president closes his eyes and drops his ink pen on the table. It points to the digit in row 3, column 6. Using this position as the starting point and proceeding downward, determine the numbers for the 9 faculty…A plant biologist conducted an experiment to compare the yields of 4 varieties of peanuts (A, B, C, D). A plot of land was divided into 16 subplots (4 rows and 4 columns) The following Latin square design was run. The responses are given in the table below: Complete the ANOVA table. Provide a suitable decision and conclusion.
- Calculate the 1. Population and sample skewness, add interpretation 2. Exact and excess sample kurtosis, add interpretation5.For a factorial design ANOVA , if there are two factors , total number of observation is 24, and each factor have 3 types , then degree of freedom for error /within group is a. 19 b. 6 c. 15 d. 17A Health Science undergraduate student at UNBC wants to estimate the proportion ofUNBC students engaging in binge drinking in response to national news magazine articlesuggesting that binge drinking is a greater problem in Canada's northern universitycampuses. She is planning to conduct a simple random sample of students using the list ofcurrently enrolled students after receiving approval from UNBC Research Ethics Board.To estimate the proportion of students engaging in binge drinking to within 2% nineteentimes out of twenty, how large should her sample size be assuming a p* value of 0.5?
- In a local bakeshop company, a study is being conducted by Industrial Engineers under the Quality Assurance Department. They need to have a sample of three donuts. These doughnuts are chosen without replacement from the batch production. Describe/write the ordered sample space for each of the following batches: a) A batch that contains 95 good doughnuts, 4 semi-good, 1 poor. b) A batch that contains 92 good donuts, 5 semi-good, 3 poor.A local government official observes an increase in the number of individuals with cardiovascular and obesity problems in his barangay. In order to improve the health conditions of his constituents, he aims to promote an easy and cheap way to reduce weight. It is known that obesity results in risk of having illnesses like diabetes and heart problems. He encouraged his constituents to participate in his "Dance for Life" project every weekend for three months. To know if the program is effective in reducing weight, he randomly selected 12 participants from the group who completed the program. The weight loss data, in kilograms, of the 12 randomly selected participants after completing the program, are 0.5, 0.7, 0.9, 1.1, 1.2, 1.3, 1.4, 2.0, 2.3, 2.4, 2.7, 3.0. It is known that the weight loss of those who have completed the dance program follows a normal distribution with variance of 3.24 ??2. a. Construct and interpret a 90% confidence interval for the true mean weight loss of the…. A college claims that 70% of students receive financial aid. Suppose that 4 students at the college are randomly selected. We are interested in the number of student in at the sample who receive financial aid
- A pharmeceutical company tests the effectiveness of a new drug used to treat migraines. The company identifieds 500 females ages 25 to 45 years old who experience migraines. They are randomly assigned into two groups, each of size 250. One group is given the drug, the other group is given a pill that looks identical to the drug pill but is inert (doesn't do anything to the body). The prescribing doctors do not know which patients receives the drug and which patients receive the inert pill. At the end of the study, 62% of women who received the drug experienced reduced symptoms, whereas 24% of women who received the inert pill experienced fewer symptoms. From this, the company concluded that 62% the drug has a 62% chance of improving symptoms for women aged 25-45 with migraine. is the number 62% a parameter or statistic?Pinky Bauer, Chief Financial Officer of Harrison Haulers, Inc., suspects irregularities in the payroll system. She knows that 2,500 payroll vouchers have been issued since January 1, 20002018, and her staff doesn't have time to inspect each voucher. So, she randomly selects 53 as a starting point and orders her staff to inspect the 53rd voucher and each voucher at an increment of 100 (53, 153, 253, etc.). Her sample is a ___________. stratified sample simple random sample convenience sample systematic sampleIn a local industrial electronics corporation, a study is being conducted by Industrial Engineers under the Quality Assurance Department. They need to have a sample of three TVS diodes. These diodes are chosen without replacement from the batch production. Describe/write the ordered sample space for each of the following batches: a) A batch that contains 95 non-defective diodes, 4 with minor defects, 1 with major defects b) A batch that contains 91 non-defective diodes, 6 with minor defects, 3 with major defects

