If the coefficient B₁ has a nonzero value, then it is helpful in predicting the value of the response variable. It ß₁ = 0, it is not helpful in predicting the value of the response variable and can be eliminated from the regression equation. To test the claim that B₁ = 0 use the test statistic t= (b₁-0)/sp. Critical values or P-values can be found using the t distribution with n-(k+ 1) degrees of freedom, where k is the number of predictor (x) variables and n is the number of observations in the sample. The standard error sp, is often provided by software. For example, see the accompanying technology display, which shows that sp, = 0.076885101 (found in the column with the heading of "Std. Err." and the row corresponding to the first predictor variable of height). Use the technology display to test the claim that B₁ = 0. Also test the claim that B₂ = 0. What do the results imply about the regression equation? Click the icon to view the technology output. Test the claim that B₁ = 0. For Ho: the test statistic is t= and the P-value is so (Round to three decimal places as needed.) Technology Output Parameter estimates: Std. Err. Alternative 148.10673 12.224816 0.71719629 0.076885101 1.0054047 0.033279093 Parameter Estimate Intercept Height Waist Ho and conclude that the regression coefficient b₁ = should DF T-Stat #0 150 #0 150 #0 150 12.115252 9.328157 30.211301 P-value <0.0001 <0.0001 <0.0001 ▼kept.
If the coefficient B₁ has a nonzero value, then it is helpful in predicting the value of the response variable. It ß₁ = 0, it is not helpful in predicting the value of the response variable and can be eliminated from the regression equation. To test the claim that B₁ = 0 use the test statistic t= (b₁-0)/sp. Critical values or P-values can be found using the t distribution with n-(k+ 1) degrees of freedom, where k is the number of predictor (x) variables and n is the number of observations in the sample. The standard error sp, is often provided by software. For example, see the accompanying technology display, which shows that sp, = 0.076885101 (found in the column with the heading of "Std. Err." and the row corresponding to the first predictor variable of height). Use the technology display to test the claim that B₁ = 0. Also test the claim that B₂ = 0. What do the results imply about the regression equation? Click the icon to view the technology output. Test the claim that B₁ = 0. For Ho: the test statistic is t= and the P-value is so (Round to three decimal places as needed.) Technology Output Parameter estimates: Std. Err. Alternative 148.10673 12.224816 0.71719629 0.076885101 1.0054047 0.033279093 Parameter Estimate Intercept Height Waist Ho and conclude that the regression coefficient b₁ = should DF T-Stat #0 150 #0 150 #0 150 12.115252 9.328157 30.211301 P-value <0.0001 <0.0001 <0.0001 ▼kept.

MATLAB: An Introduction with Applications
6th Edition
ISBN:9781119256830
Author:Amos Gilat
Publisher:Amos Gilat
Chapter1: Starting With Matlab
Section: Chapter Questions
Problem 1P

Related questions
Question
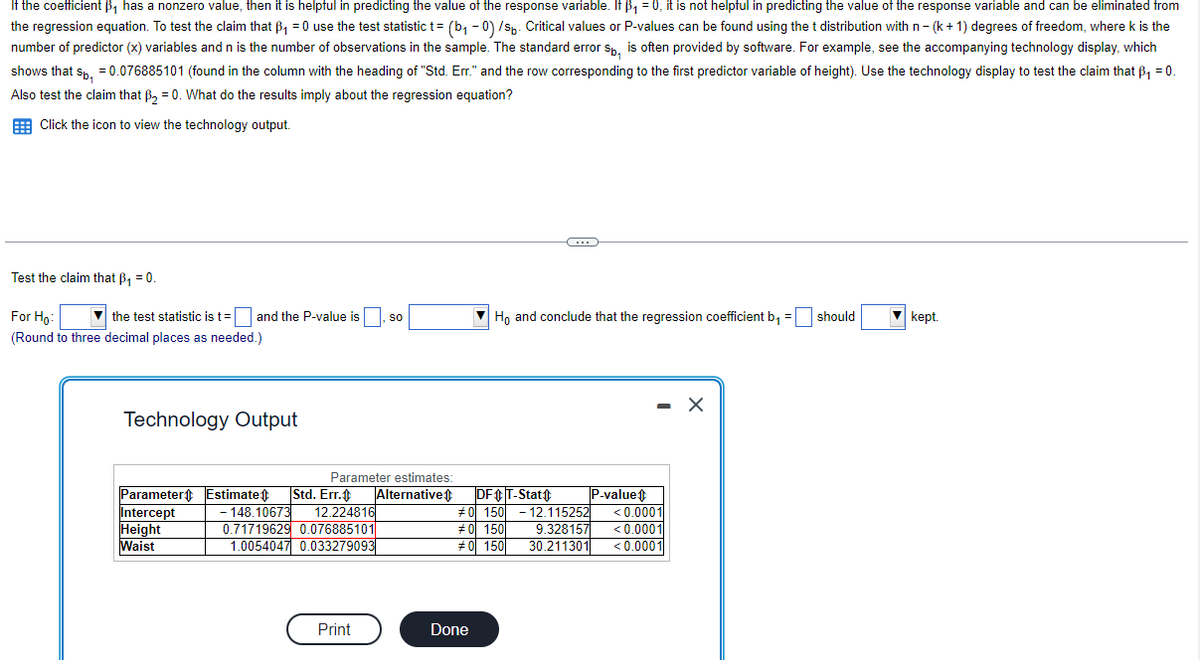
Transcribed Image Text:If the coefficient ß₁ has a nonzero value, then it is helpful in predicting the value of the response variable. If B₁ = 0, it is not helpful in predicting the value of the response variable and can be eliminated from
the regression equation. To test the claim that B₁ = 0 use the test statistic t = (b₁-0) /sp. Critical values or P-values can be found using the t distribution with n-(k+1) degrees of freedom, where k is the
number of predictor (x) variables and n is the number of observations in the sample. The standard error sp, is often provided by software. For example, see the accompanying technology display, which
shows that sp, = 0.076885101 (found in the column with the heading of "Std. Err." and the row corresponding to the first predictor variable of height). Use the technology display to test the claim that B₁ = 0.
Also test the claim that B₂ = 0. What do the results imply about the regression equation?
Click the icon to view the technology output.
Test the claim that B₁ = 0.
For Ho
the test statistic is t= and the P-value is SO
(Round to three decimal places as needed.)
Technology Output
Parameter Estimate
Intercept
Height
Waist
Parameter estimates:
Alternative
Std. Err.
- 148.10673 12.224816
0.71719629 0.076885101
1.0054047 0.033279093
Print
Ho and conclude that the regression coefficient b₁ = should
DF₁ T-Stat
Done
C
#0 150
#0 150
#0 150 12.115252
P-value
<0.0001
9.328157 <0.0001
<0.0001
30.211301
X
kept.
Expert Solution
This question has been solved!
Explore an expertly crafted, step-by-step solution for a thorough understanding of key concepts.

This is a popular solution!

Trending now
This is a popular solution!

Step by step
Solved in 2 steps

Recommended textbooks for you
MATLAB: An Introduction with Applications
Statistics
ISBN:
9781119256830
Author:
Amos Gilat
Publisher:
John Wiley & Sons Inc

Probability and Statistics for Engineering and th…
Statistics
ISBN:
9781305251809
Author:
Jay L. Devore
Publisher:
Cengage Learning

Statistics for The Behavioral Sciences (MindTap C…
Statistics
ISBN:
9781305504912
Author:
Frederick J Gravetter, Larry B. Wallnau
Publisher:
Cengage Learning
MATLAB: An Introduction with Applications
Statistics
ISBN:
9781119256830
Author:
Amos Gilat
Publisher:
John Wiley & Sons Inc
Probability and Statistics for Engineering and th…
Statistics
ISBN:
9781305251809
Author:
Jay L. Devore
Publisher:
Cengage Learning
Statistics for The Behavioral Sciences (MindTap C…
Statistics
ISBN:
9781305504912
Author:
Frederick J Gravetter, Larry B. Wallnau
Publisher:
Cengage Learning

Elementary Statistics: Picturing the World (7th E…
Statistics
ISBN:
9780134683416
Author:
Ron Larson, Betsy Farber
Publisher:
PEARSON

The Basic Practice of Statistics
Statistics
ISBN:
9781319042578
Author:
David S. Moore, William I. Notz, Michael A. Fligner
Publisher:
W. H. Freeman

Introduction to the Practice of Statistics
Statistics
ISBN:
9781319013387
Author:
David S. Moore, George P. McCabe, Bruce A. Craig
Publisher:
W. H. Freeman