agency collects data on various aspects of housing costs. Here's a scatterplot of the sing Cost Index (HCI) versus the Median Family Income (MFI). The correlation is r=0.69. mean HCI is 328.9, with a standard deviation of 111.06. The mean MELİS $46234, with a ndard deviation of $7042.75. Complete parts a through f. 700 - HCI 600 + 500 400 + 300 - 200 + MFI 35 40 45 50 55 60 65 ..... What is the equation that predicts housing cost index from Median Family Income? Ci-D+ (OMFI Round the final answer to four decimal places as needed. Round all intermediate values to four decimal places as needed.) =) For a particular area with MEL = $44,993, what would be the predicted HCI? (Round to two decimal places as needed.) d) This particular area has an MEI of $44,993 and an HCI of 560.48. How far off is the prediction in part (c) from the actual HCI? (Round to two decimal places as needed.)
agency collects data on various aspects of housing costs. Here's a scatterplot of the sing Cost Index (HCI) versus the Median Family Income (MFI). The correlation is r=0.69. mean HCI is 328.9, with a standard deviation of 111.06. The mean MELİS $46234, with a ndard deviation of $7042.75. Complete parts a through f. 700 - HCI 600 + 500 400 + 300 - 200 + MFI 35 40 45 50 55 60 65 ..... What is the equation that predicts housing cost index from Median Family Income? Ci-D+ (OMFI Round the final answer to four decimal places as needed. Round all intermediate values to four decimal places as needed.) =) For a particular area with MEL = $44,993, what would be the predicted HCI? (Round to two decimal places as needed.) d) This particular area has an MEI of $44,993 and an HCI of 560.48. How far off is the prediction in part (c) from the actual HCI? (Round to two decimal places as needed.)

Glencoe Algebra 1, Student Edition, 9780079039897, 0079039898, 2018
18th Edition
ISBN:9780079039897
Author:Carter
Publisher:Carter
Chapter10: Statistics
Section10.4: Distributions Of Data
Problem 19PFA

Related questions
Question
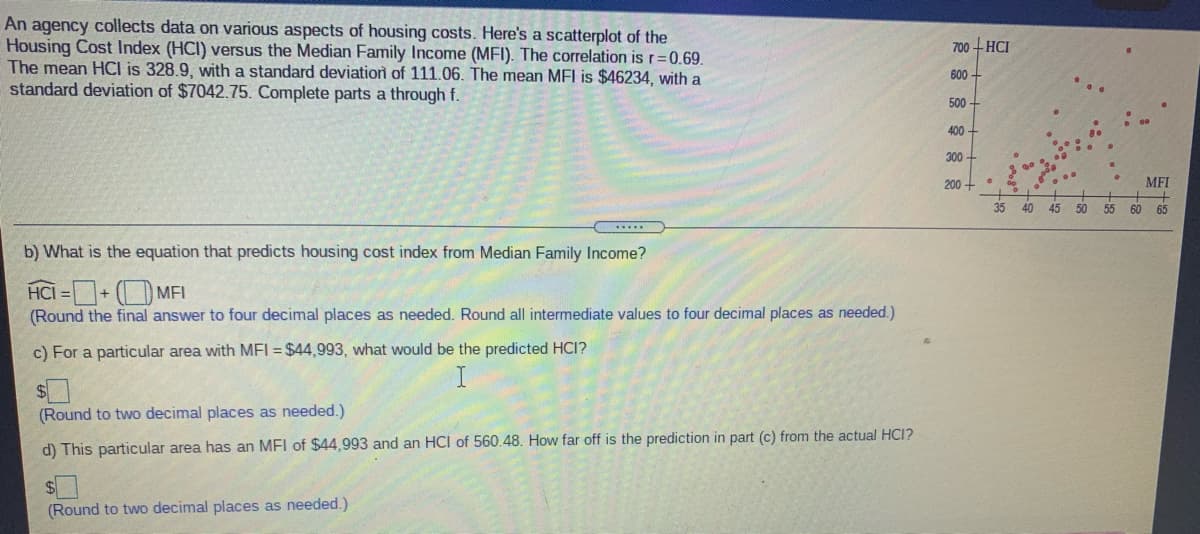
Transcribed Image Text:An agency collects data on various aspects of housing costs. Here's a scatterplot of the
Housing Cost Index (HCI) versus the Median Family Income (MFI). The correlation is r=0.69.
The mean HCI is 328.9, with a standard deviatioi of 111.06. The mean MFI is $46234, with a
standard deviation of $7042.75. Complete parts a through f.
700 - HCI
600 -
500
400
300 -
200-
MFI
35
40
45
50
55
60
65
b) What is the equation that predicts housing cost index from Median Family Income?
HCI =+(MFI
(Round the final answer to four decimal places as needed. Round all intermediate values to four decimal places as needed.)
c) For a particular area with MEL = $44,993, what would be the predicted HCI?
(Round to two decimal places as needed.)
d) This particular area has an MFI of $44,993 and an HCI of 560.48. How far off is the prediction in part (c) from the actual HCI?
$4
(Round to two decimal places as needed.)
Expert Solution
This question has been solved!
Explore an expertly crafted, step-by-step solution for a thorough understanding of key concepts.

This is a popular solution!

Trending now
This is a popular solution!

Step by step
Solved in 4 steps with 3 images

Recommended textbooks for you
Glencoe Algebra 1, Student Edition, 9780079039897…
Algebra
ISBN:
9780079039897
Author:
Carter
Publisher:
McGraw Hill

Big Ideas Math A Bridge To Success Algebra 1: Stu…
Algebra
ISBN:
9781680331141
Author:
HOUGHTON MIFFLIN HARCOURT
Publisher:
Houghton Mifflin Harcourt
Glencoe Algebra 1, Student Edition, 9780079039897…
Algebra
ISBN:
9780079039897
Author:
Carter
Publisher:
McGraw Hill
Big Ideas Math A Bridge To Success Algebra 1: Stu…
Algebra
ISBN:
9781680331141
Author:
HOUGHTON MIFFLIN HARCOURT
Publisher:
Houghton Mifflin Harcourt