Ages Number of students 15-18 3 19-22 23-26 10 27-30 2 31-34 3 35-38 10 Based on the frequency distribution above, find the relative frequency for the class with a lower class limit of 15 Give your answer as a percent, rounded to 1 place after the decimal point, if necessary. Type only a number in the answer box (do NOT type "%" after your answer). Relative Frequency = Submit Question
Ages Number of students 15-18 3 19-22 23-26 10 27-30 2 31-34 3 35-38 10 Based on the frequency distribution above, find the relative frequency for the class with a lower class limit of 15 Give your answer as a percent, rounded to 1 place after the decimal point, if necessary. Type only a number in the answer box (do NOT type "%" after your answer). Relative Frequency = Submit Question

Glencoe Algebra 1, Student Edition, 9780079039897, 0079039898, 2018
18th Edition
ISBN:9780079039897
Author:Carter
Publisher:Carter
Chapter10: Statistics
Section: Chapter Questions
Problem 13PT

Related questions
Question
Transcribed Image Text:tions)
3.95/10
4/10 answered
Pr
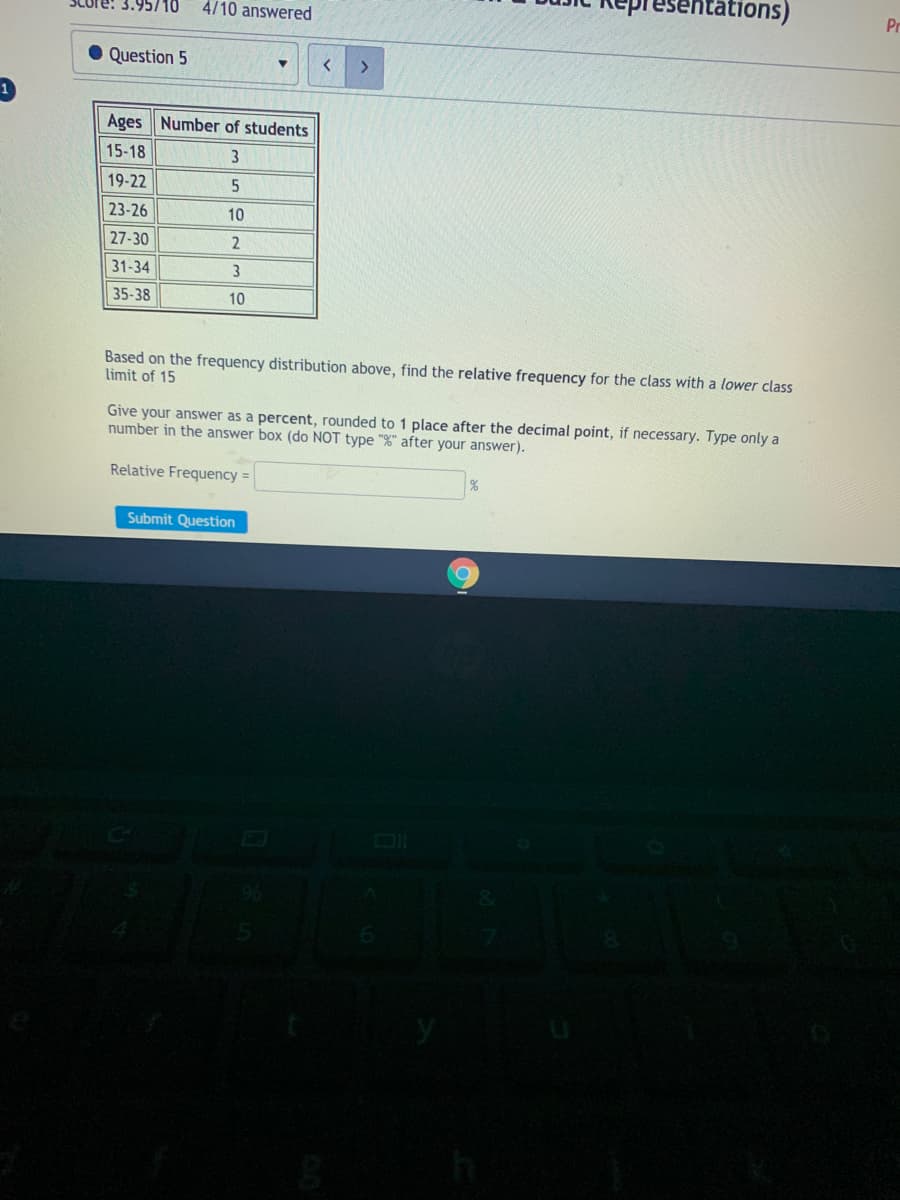
• Question 5
<.
Ages Number of students
15-18
3
19-22
23-26
10
27-30
31-34
3
35-38
10
Based on the frequency distribution above, find the relative frequency for the class with a lower class
limit of 15
Give your answer as a percent, rounded to 1 place after the decimal point, if necessary. Type only a
number in the answer box (do NOT type "%" after your answer).
Relative Frequency =
Submit Question
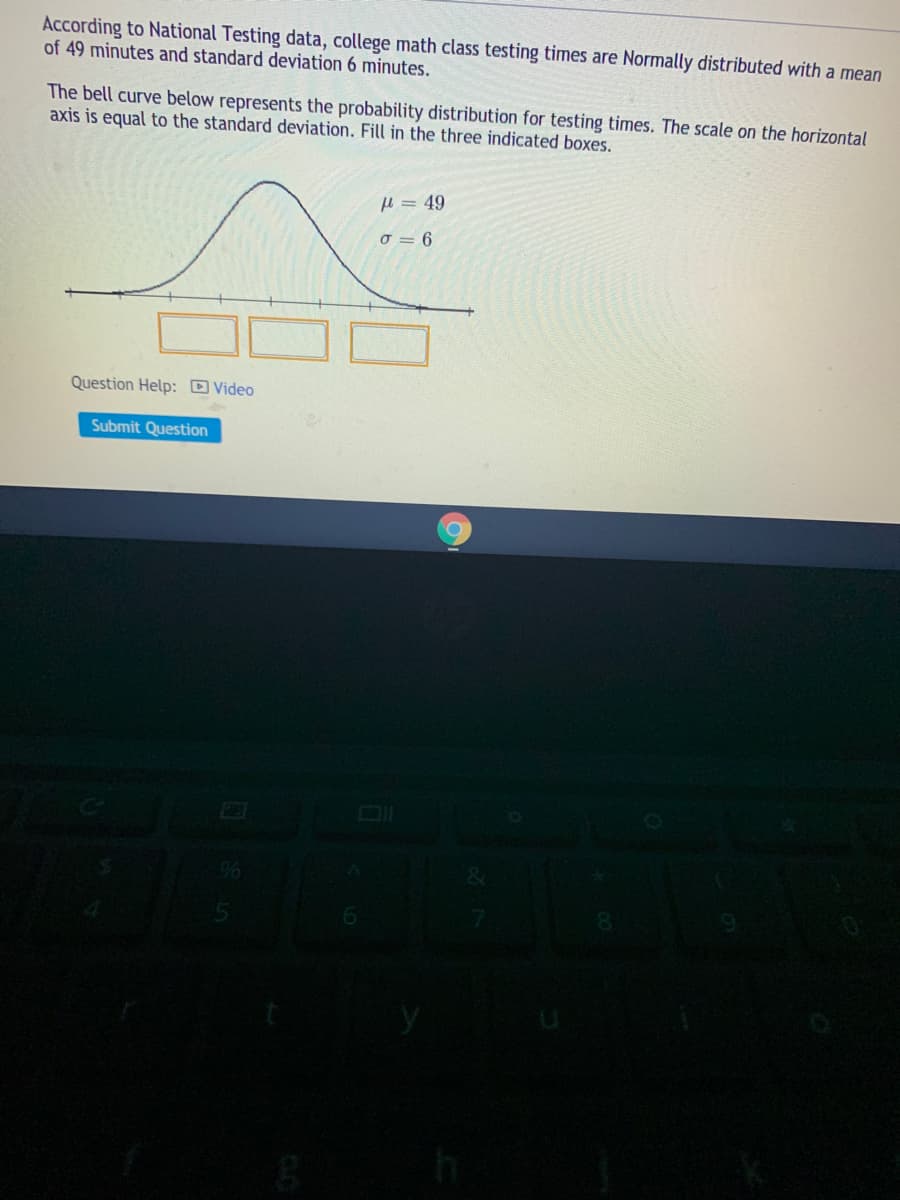
Transcribed Image Text:According to National Testing data, college math class testing times are Normally distributed with a mean
of 49 minutes and standard deviation 6 minutes.
The bell curve below represents the probability distribution for testing times. The scale on the horizontal
axis is equal to the standard deviation. Fill in the three indicated boxes.
H= 49
O = 6
Question Help: D Video
Submit Question
Expert Solution
This question has been solved!
Explore an expertly crafted, step-by-step solution for a thorough understanding of key concepts.

This is a popular solution!

Trending now
This is a popular solution!

Step by step
Solved in 2 steps

Recommended textbooks for you
Glencoe Algebra 1, Student Edition, 9780079039897…
Algebra
ISBN:
9780079039897
Author:
Carter
Publisher:
McGraw Hill
Glencoe Algebra 1, Student Edition, 9780079039897…
Algebra
ISBN:
9780079039897
Author:
Carter
Publisher:
McGraw Hill