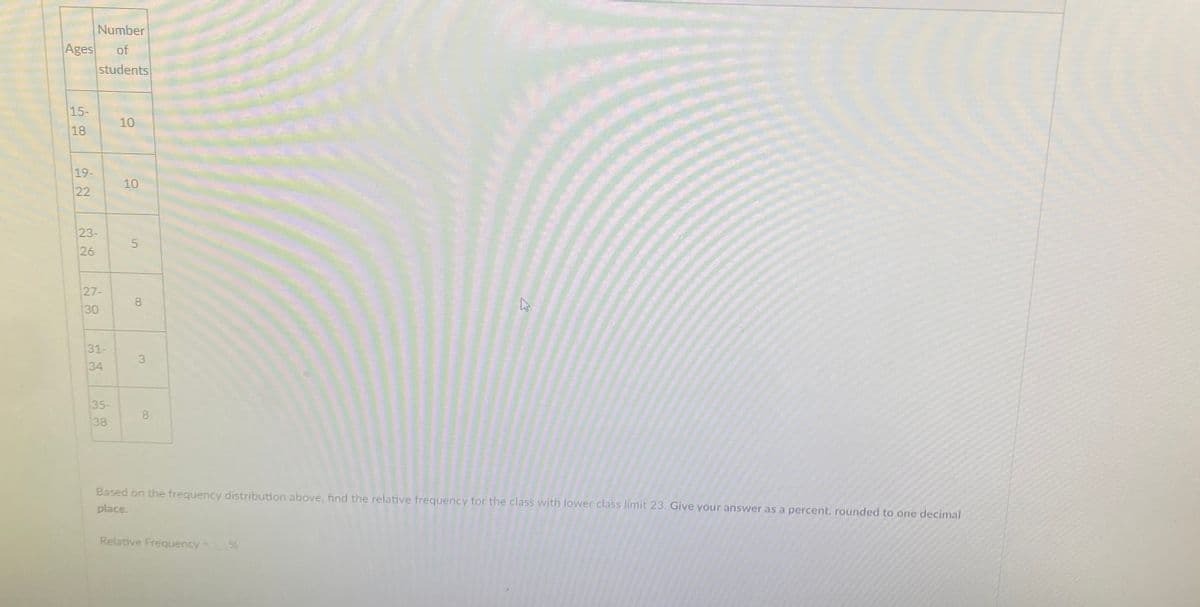
Number Ages students of 15- 18 10 19. 10 22 23 26 27- 30 31- 34 3 35 38 Based on the frequency distribution above, find the relative frequency for the class with lower class limit 23. Give your answer as a percent. rounded to one decimal place Relative Frequency


Q: Ages Number of students 15-18 3 19-22 23-26 10 27-30 2 31-34 3 35-38 10 Based on the frequency…
A: Frequency for a grouped data gives the number of observations in a class. For example if a class is…
Q: ges Number of students 15-18 5 19-22 8 23-26 10 27-30 8 31-34 8 35-38 10 Based on the frequency…
A: Ages Number of students 15-18 5 19-22 8 23-26 10 27-30 8 31-34 8 35-38 10 total n =…
Q: Ages Number of students 15-18 19-22 6 23-26 10 27-30 4 31-34 5 35-38 6 Based on the frequency…
A: Ages NUMBER OF STUDENTS 15-18 5 19-22…
Q: The data represent the time, in minutes, spent reading a political blog in a day. Construct a…
A: Number of classes = 5 lowest class limit = 0 n = 20
Q: The data represent the time, in minutes, spent reading a political blog in a day. Construct a…
A: Provided data is ; 0 21 3 7 3 29 7 7 16 23 12 23 10 9 12…
Q: Ages Number of students 15-18 8 19-22 8 23-26 3 27-30 10 31-34 3 35-38 5 Find the…
A: Relative Frequency= Frequency of Class/ Total Frequency Frequency of lower class limit 19 is 8 Total…
Q: Ages Number of students 15-18 8 19-22 6 23-26 9 27-30 2 31-34 3 35-38 7 Based on the frequency…
A:
Q: The data represent the time, in minutes, spent reading a political blog in a day. Construct a…
A: Solution: Given : X : Time ( in minutes ) spent reading political blog in a day X = 12,…
Q: iven the data below: 87, 81, 96, 75, 82, 74, 99, 51, 64, 72, 63, 59, 77, 88, 99, 66, 55, 50, 70,…
A:
Q: The data represent the time, in minutes, spent reading a political blog in a day. Construct a…
A: Obtain the frequency table. The frequency table is obtained below as follows: From the…
Q: 34 21 25 23 The data represent the time, in minutes, spent reading a political blog in a day.…
A: Given that: A data set is given. Firstly make a frequency distribution. And find cumulative…
Q: The data represent the time, in minutes, spent reading a political blog in a day. Construct a…
A:
Q: Ages Number of students 15-18 2 19-22 8 23-26 7 27-30 4 31-34 7 35-38 10 Based on the frequency…
A: Ages number of students relative frequency 15-18 2 238×100=5.3% 19-22 8 838×100=21.1% 23-26 7…
Q: Ages Number of students 15-18 2 19-22 4 23-26 4 27-30 3 31-34 35-38 9. Based on the frequency…
A: Given data : Total frequency = 2+4+4+3+2+9 = 24 To find: Based on…
Q: 50 psychology students took a standardized test. The scores are summarized in the GFDT below. Scores…
A: relative frequency of class = frequency of the class/ Total frequency
Q: 15 35 10 10 The data represent the time, midpoints, relative frequencies, and cumulative…
A:
Q: The data represent the time, in minutes, spent reading a political blog in a day. Construct a…
A: Given data is11,6,11,3,60,19,32,35,31,33,24,2,6,3930,4,26,0,36
Q: Ages number of students 15-18 4 19-22 6 23-26…
A: Given Data : Ages number of students 15-18 4 19-22 6 23-26…
Q: The data represent the time, in minutes, spent reading a political blog in a day. Construct a…
A:
Q: Ages Number of students 15-18 3 19-22 7 23-26 10 27-30 5 31-34 3 35-38 8 Based on the frequency…
A:
Q: Ages Number of students 15-18 8 19-22 5 23-26 3 27-30 8 31-34 5 35-38 10 Based on the frequency…
A:
Q: The data represent the time, in minutes, spent reading a political blog in a day. Construct a…
A: Solution : The data represents the time in minute spent reading a political blog in a day. 3 18…
Q: Fifty part-time students were asked how many courses they were taking this term. The (Incomplete)…
A:
Q: - Ages Number of students 15-18 6. 2 19-22 23-26 27-30 4. 31-34 7. 35-38 Find the relative frequency…
A: The number of values corresponding to a class or observation is defined as the frequency of that…
Q: The data represent the time, in minutes, spent reading a political blog in a day. Construct a…
A:
Q: The data represent the time, in minutes, spent reading a political blog in a day. Construct a…
A: Class limits: These are the two endpoints of a class interval used for tally marking the given…
Q: The data set below represents the ages of 30 executives. Which ages are above the 75th percentile?…
A: Given information: The data set representing the ages of n = 30 executives is provided below: 42…
Q: Ages Number of students 15-18 19-22 23-26 27-30 31-34 35-38 Based on the frequency distribution…
A: Given, Age number of student 15-18 2 19-22 7 23-26 4 27-30 4 31-34 2 35-38 3 total…
Q: Ages Number of students 15-18 3. 19-22 23-26 10 27-30 31-34 3 35-38 10 Based on the frequency…
A: Consider the given table. Total number of students is given by N=3+5+10+2+3+10=33 Now, the class…
Q: The data represent the time, in minutes, spent reading a political blog in a day. Construct a…
A: Given data is2,18,5,0,11,16,19,1,14,14,0,14,14,19,6,1,2,9,5,5Arrange the data in Acending…
Q: Ages 15-18 Number of students 7 19-22 23-26 27-30 31-34 9. 35-38 Based on the frequency distribution…
A:
Q: The data represent the time, in minutes, spent reading a political blog in a day. Construct a…
A: A frequency distribution shows the class interval and their frequencies.
Q: 2. After you've performed the survey described above, you are interested in describing the ages of…
A: We will use the below formulas to complete the table: Class Midpoint= ( Upper limit of age-Lower…
Q: Ages Number of students 15-18 6 19-22 7 23-26 3 27-30 7 31-34 8 35-38 10 Based on the frequency…
A:
Q: Ages Number of students 5-18 6 9-22 6. 3-26 10 27-30 7 31-34 9. 35-38 9. Based on the frequency…
A:
Q: In a survey, 19 people reported the number of hours they spent on the Internet last week. Their…
A: Given: Sr. No. Data 1 21 2 22 3 19 4 10 5 5 6 14 7 24 8 9 9 5 10 16 11…
Q: The data represent the time, in minutes, spent reading a political blog in a day. Construct a…
A:
Q: Ages Number of students 15-18 3 19-22 10 23-26 9 27-30 8 31-34 7 35-38 3 Based on the frequency…
A: Given, Formula for relative frequency =Number of student in a particular class/ Total number of…
Q: Ages Number of students 15-18 4 19-22 2 23-26 10 27-30 5 31-34 10 35-38 7 Based on the frequency…
A: Given data:
Q: represent the time, in minutes, spent reading a political blog in a day. Construct a frequency…
A:
Q: The data represent the time, in minutes, spent reading a political blog in a day. Construct a…
A: It is been asked to construct frequency distribution table using given data.
Q: The data represent the time, in minutes, spent reading a political blog in a day. Construct a…
A: Range of the data set = Maximum value - Minimum value = 39-0 = 39 number of classes to be formed = 5…
Q: 10 4 The data represent the time, in minutes, spent reading a political blog in a day. Construct a…
A: The relative frequency can be obtained using the formula as:
Q: Ages Number of students 15-18 2 19-22 10 23-26 5 27-
A: Ages Number of students 15-18 2 19-22 10 23-26 5 27-30 4 31-34 5 35-38 3
Q: Find frequency histogram, frequency polygon, frequency Cumulative Curve ( less than) and percentage…
A:
Q: The data represent the time, in minutes, spent reading a political blog in a day. Construct a…
A:
Q: Ages Number of students 15-18 6 19-22 6 23-26 2 27-30 2 31-34 9 35-38 10 Based on the frequency…
A: Given Ages Number of student 15-18 6 19-22 6 23-26 2 27-30 2 31-34 9 35-38 10
Q: The data represent the time, in minutes, spent reading a political blog in a day. Construct a…
A: * SOLUTION :-
Q: Number of students Ages 15-18 2 19-22 4 23-26 27-30 31-34 3 35-38 7 Based on the frequency…
A: Given data is Ages Number of students 15-18 2 19-22 4 23-26 5 27-30 6 31-34 3 35-38 7…
Q: Ages Number of students 15-18 19-22 23-26 3 27-30 31-34 8 35-38 9. Based on the frequency…
A: Ages Number of students Cumulative frequency 15-18 5 5 19-22 5 5+5=10 23-26 3 10+3=13 27=30…


Trending now
This is a popular solution!

Step by step
Solved in 2 steps with 2 images

- Identify the lower class limits, upper-class limits, class width, class midpoints, and class boundaries for the given frequency distribution. Also, identify the number of individuals included in the summary. (Type integers or decimals. Do not round. Use ascending order.) Age (yr) when award was won Frequency 10-19 28 20-29 36 30-39 15 40-49 3 50-59 4 60-69 1 70-79 2The density of people per square kilometer for African countries is in table #2.2.11 ('Density of people,' 2013). Create a frequency distribution and a relative frequency distribution using 7 classes. a) Since data were collected for variable(s), the correct graph to make is a . b) Using the formula class width = (maxX - minX)/(number of classes) and rounding up to the next whole number, the class width is Complete the frequency/relative frequency table using 7 classes. Round relative frequencies to 3 decimal places.The graph illustrates the distribution of test scores taken by College Algebra students. The maximum possible score on the test was 120, while the mean score was 72 and the standard deviation was 11. 395061728394105Distribution of Test Scores Use the "Empirical Rule", not a calculator or other technology. Do not round your answers. What is the approximate percentage of students who scored between 50 and 94 on the test?%What is the approximate percentage of students who scored between 61 and 72?%What is the approximate percentage students who scored between 61 and 83 on the test?%What is the approximate percentage of students who scored higher than 94 on the test?
- The relative frequency associated with a particular class in the population is the fraction of measurements in the population falling in that class. True FalseInclusions are defects in poured metal caused by contaminants. The number of (large) inclusions in cast iron follows a Poisson distribution with a rate of 1.9 per cubic millimetre. What is the volume of material to inspect such that the probability of at least one inclusion is 0.99? Please enter the answer to 2 decimal places.mathematichal statistic
- Using these numbers.... 11,13,22,28,36,36,36,37,37,37,38,41,43,44,46, 47,51,51,51,53,61,62,63,64,72,72,74,76,85,90 Calculate the CV or Coefficient of Variation for this distribution Calculate the percentile of 75 in this distribution Calculate the z-score of 757. I am producing 400-gram loaf breads in one of my production lines and measured the weights of 28 loaf breads from the same batch as shown in table below. (*see attached image for the table.)A. Summarize data in a frequency distribution table using a 5-gram interval. B. Illustrate data in a frequency histogram using a 5-gram interval.C. Compute for relative frequency of 3rd interval and cumulative relative frequency of the 4th interval.A distribution of values is normal with a mean of 210 and a standard deviation of 20. From this distribution, you are drawing samples of size 32.Find the interval containing the middle-most 94% of sample means: Enter your answer using interval notation. In this context, either inclusive or exclusive intervals would be acceptable. Your numbers should be accurate to 1 decimal places. Answers obtained using exact z-scores or z-scores rounded to 3 decimal places are accepted. I am confused because I don't understand interval notation.
- 2. Central limit theorem Imagine that you are doing an exhaustive study on the children in all of the preschools in your school district. You are particularly interested in how much time children spend with parents on weekdays. You find that for this population of 2,431 children, the average number of minutes spent with parents on weekdays is μ = 223.17, with a standard deviation of σ = 148.75. You select a random sample of 25 children of preschool age in this same school district. In this sample, you find that the average number of minutes the children spend with parents on weekdays is M = 245.49, with a standard deviation of s = 163.63. The difference between M and μ is due to the . Suppose you compile all possible samples of 25 children of preschool age in your school district. If you calculate the mean of each sample (M) and create a frequency distribution of these means, this distribution is referred to as the . The mean of this distribution, that…A study investigating the relationship between age and annual medical expenses randomly samples 100 individuals in a city. It is hoped that the sample will have a similar mean age as the entire population. If the standard deviation of the ages of all individuals in the city is σ = 20, find the probability that the mean age of the individuals sampled is within 1.5 years of the mean age for all individuals in the city. Do not round your answer. Hints: Find the sampling distribution of the sample mean age and use the central limit theorem. You don’t have to know the population mean to answer this, but if it makes it easier, use a value such as μ=35.Inclusions are defects in poured metal caused by contaminants. The number of (large) inclusions in cast iron follows a Poisson distribution with a rate of 3.4 per cubic millimetre. What is the probability of at least one inclusion in a cubic millimetre? Please enter the answer to 3 decimal places.