The proportion of all high school students who watch national news is p = 0.57. A random sample of 60 high school students is selected. Which of the following is the correct calculation and interpretation of the standard deviation of the sampling distribution of ? O og = 0.004. In SRSS of size 60, the sample proportion of high school students who watch the national news typically varies 0.004 from the true proportion, p = 0.71. oz=0.064. In SRSS of size 60, the sample proportion of high school students who watch the national news typically varies 0.064 from the true proportion, p = 0.71. O og=0.245. In SRSS of size 60, the sample proportion of high school students who watch the national news typically varies 0.245 from the true proportion, p = 0.71. O og =0.570. In SRSS of size 60, the sample proportion of high school students who watch the national news typically varies 0.57o from the true proportion, p = 0.71.
The proportion of all high school students who watch national news is p = 0.57. A random sample of 60 high school students is selected. Which of the following is the correct calculation and interpretation of the standard deviation of the sampling distribution of ? O og = 0.004. In SRSS of size 60, the sample proportion of high school students who watch the national news typically varies 0.004 from the true proportion, p = 0.71. oz=0.064. In SRSS of size 60, the sample proportion of high school students who watch the national news typically varies 0.064 from the true proportion, p = 0.71. O og=0.245. In SRSS of size 60, the sample proportion of high school students who watch the national news typically varies 0.245 from the true proportion, p = 0.71. O og =0.570. In SRSS of size 60, the sample proportion of high school students who watch the national news typically varies 0.57o from the true proportion, p = 0.71.

College Algebra (MindTap Course List)
12th Edition
ISBN:9781305652231
Author:R. David Gustafson, Jeff Hughes
Publisher:R. David Gustafson, Jeff Hughes
Chapter8: Sequences, Series, And Probability
Section8.7: Probability
Problem 58E: What is meant by the sample space of an experiment?

Related questions
Question
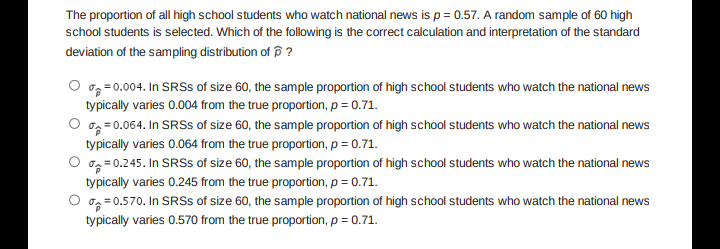
Transcribed Image Text:The proportion of all high school students who watch national news is p= 0.57. A random sample of 60 high
school students is selected. Which of the following is the correct calculation and interpretation of the standard
deviation of the sampling distribution of p ?
O og = 0.004. In SRSS of size 60, the sample proportion of high school students who watch the national news
typically varies 0.004 from the true proportion, p = 0.71.
og =0.064. In SRSS of size 60, the sample proportion of high school students who watch the national news
typically varies 0.064 from the true proportion, p = 0.71.
oz= 0.245. In SRSS of size 60, the sample proportion of high school students who watch the national news
typically varies 0.245 from the true proportion, p = 0.71.
O og=0.570. In SRSS of size 60, the sample proportion of high school students who watch the national news
typically varies 0.570 from the true proportion, p = 0.71.
Expert Solution
This question has been solved!
Explore an expertly crafted, step-by-step solution for a thorough understanding of key concepts.

This is a popular solution!

Trending now
This is a popular solution!

Step by step
Solved in 2 steps with 2 images

Recommended textbooks for you
College Algebra (MindTap Course List)
Algebra
ISBN:
9781305652231
Author:
R. David Gustafson, Jeff Hughes
Publisher:
Cengage Learning
College Algebra (MindTap Course List)
Algebra
ISBN:
9781305652231
Author:
R. David Gustafson, Jeff Hughes
Publisher:
Cengage Learning