albany.edu how to screenshot on mac - Googl... Course Schedule – Spring 2020-So... Mail - Mangia, Louis M - Outlook https://blackboard.albany.edu/bbc.. https://www.albany.edu/~by87227.. My Questions | bartleby 5. Suppose the quantity of good X demanded by individual 1 is given by X1 = 10 – 2Px+0.0111 +0.4Py and the quantity of X demanded by individual 2 is X2 = 5 – Px +0.0212 + 0.2Py a) What is the market demand function for total X (= X1+X2) as a function of Px, I1, I2, and Py. b) Graph the two individual demand curves (with X on the horizontal axis, = = 1000, and Py = 10. Px on the vertical axis) for the case I1 1000, I2 6. c) Using these individual demand curves, construct the market demand curve for total X. What is the algebraic equation for this curve? albany.edu My Questions | bartleby how to screenshot on mac - Googl... Mail - Mangia, Louis M - Outlook Course Schedule – Spring 2020-So... https://blackboard.albany.edu/bbc.. https://www.albany.edu/~by87227.. d) Now suppose I1 increases to 1100 and I2 decreases to 900. How would the market demand curve shift? How would the individual demand curves shift? Graph these new curves. e) Suppose Py rises to 15. Graph the new individual and market demand curves that would result.

Microeconomic Theory
12th Edition
ISBN:9781337517942
Author:NICHOLSON
Publisher:NICHOLSON
Chapter4: Utility Maximization And Choice
Section: Chapter Questions
Problem 4.2P
icon
Related questions
Question

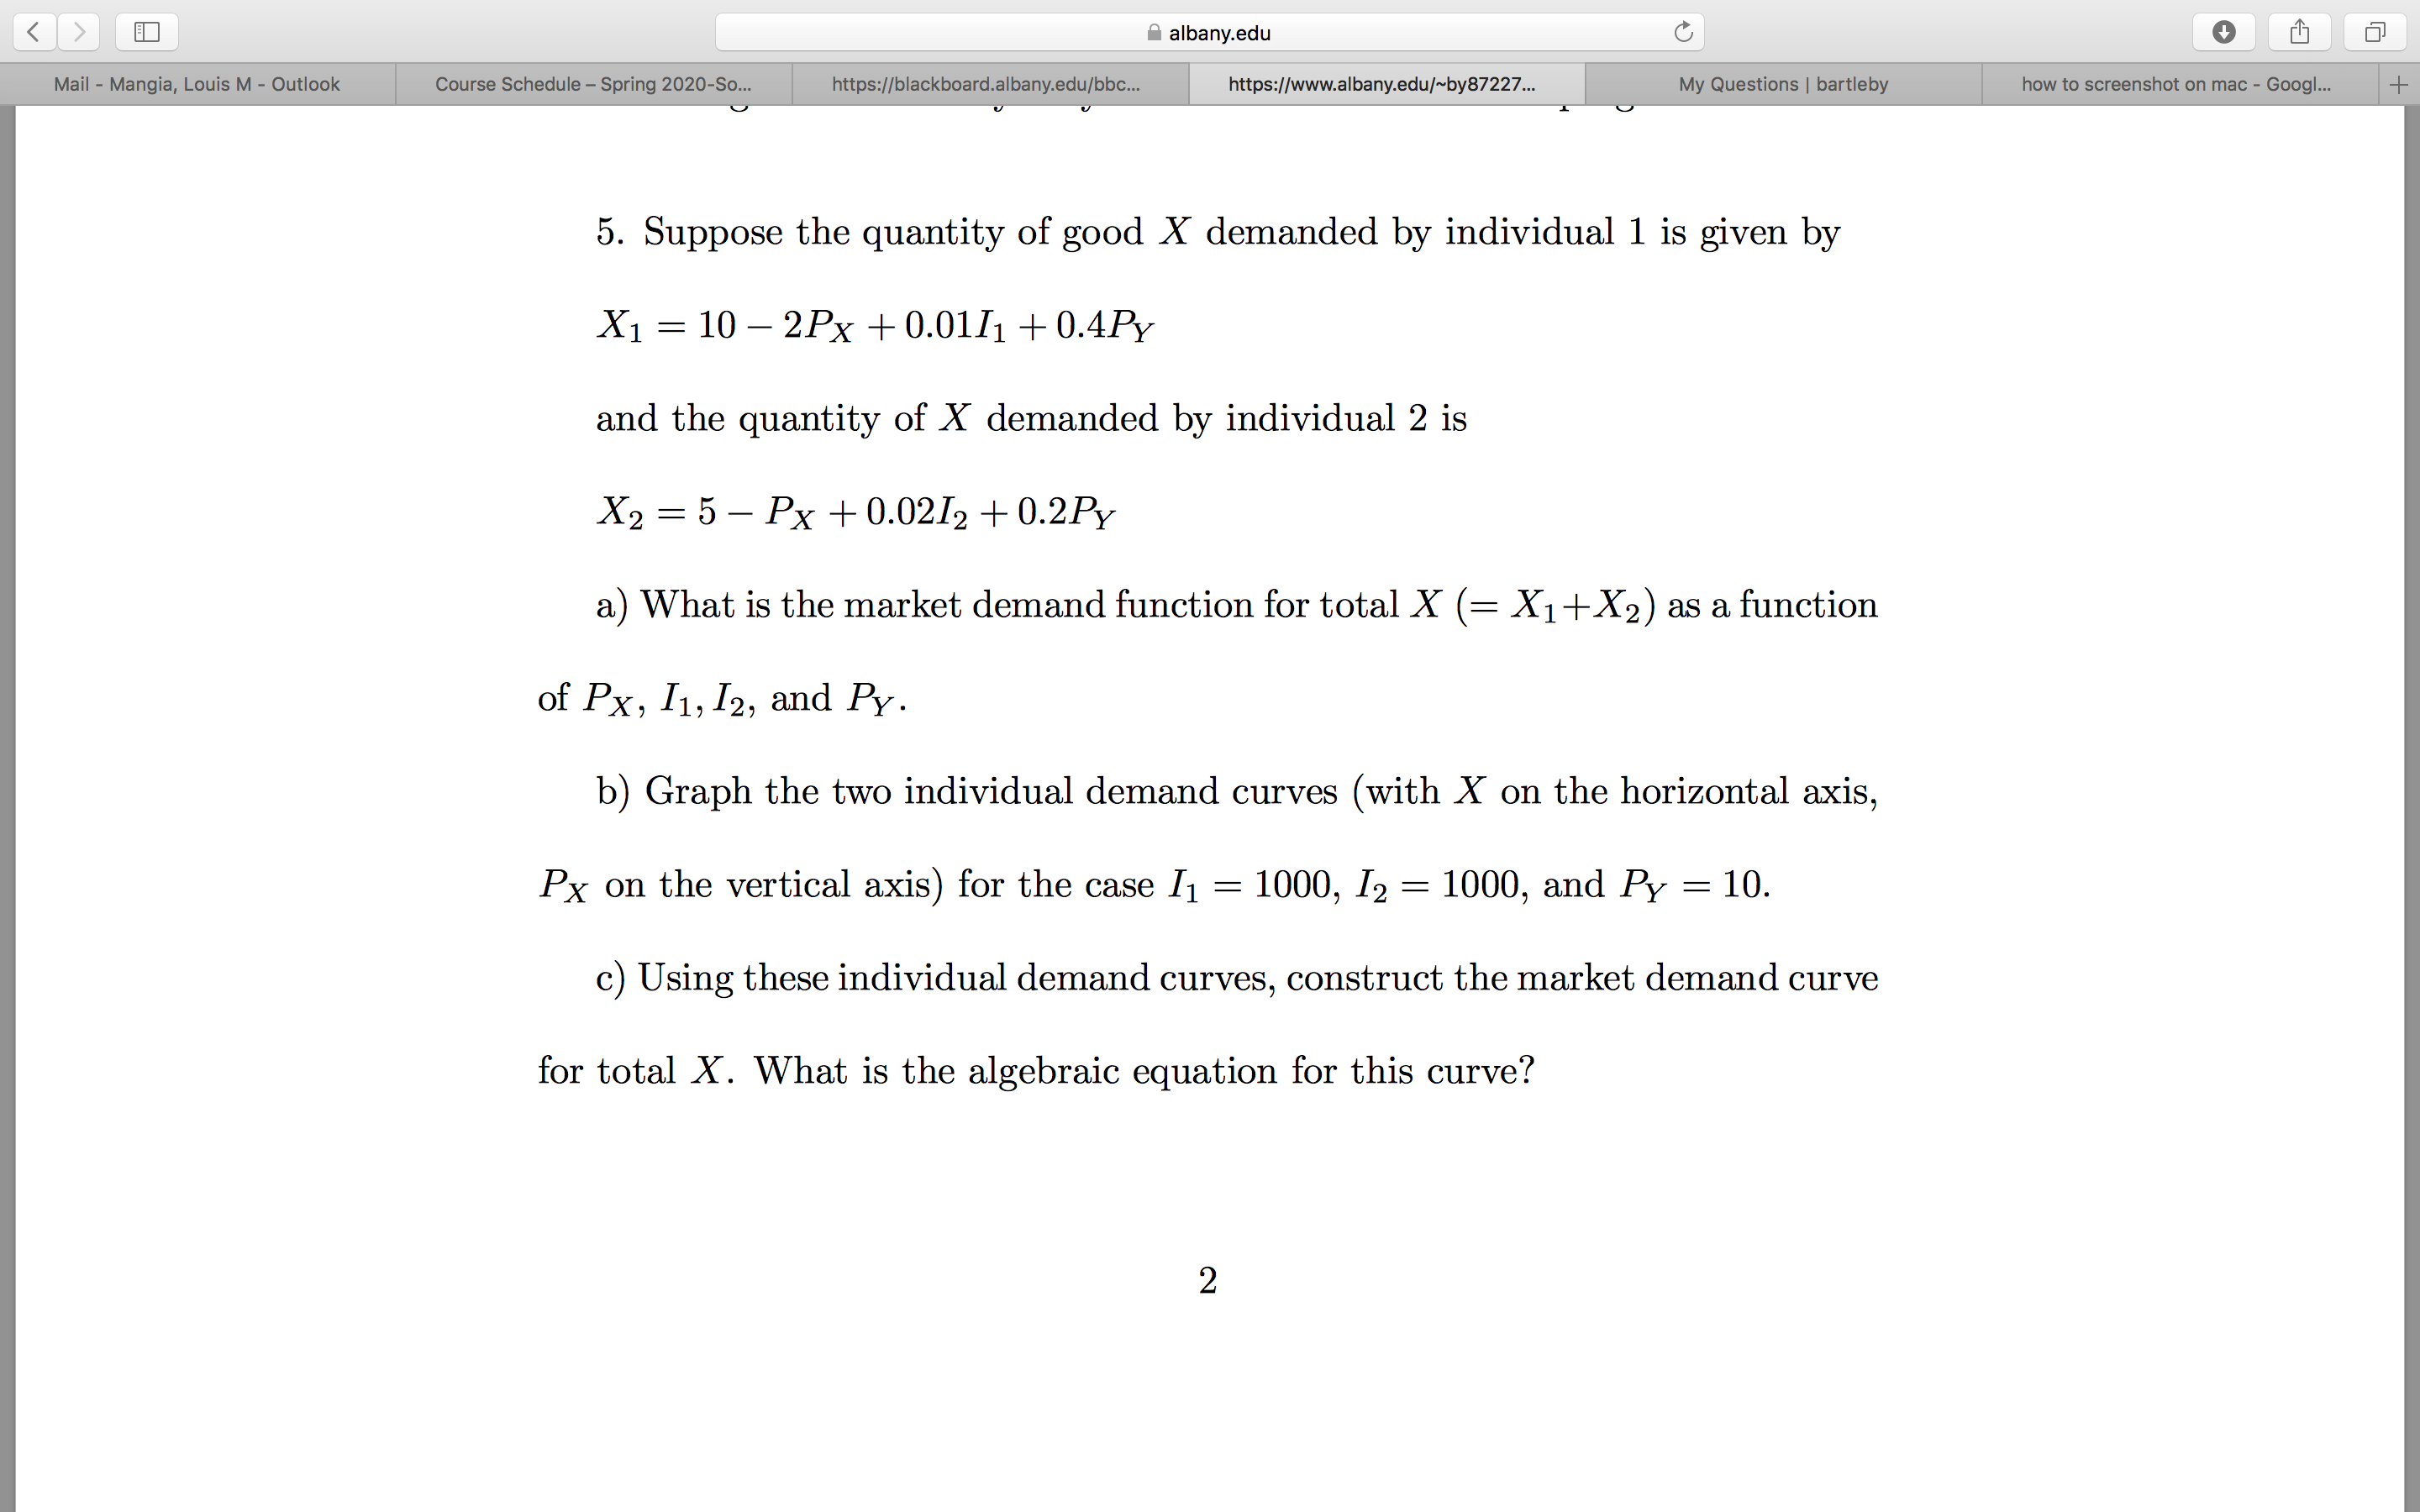
5 Suppose the quantity of good X demanded by individual 1 is given byX1 = 10−2PX +0.01I1 +0.4PY
and the quantity of X demanded by individual 2 is
X2 =5−PX +0.02I2 +0.2PY

a) What is the market demand function for total X (= X1+X2) as a function of PX, I1,I2, and PY .

b) Graph the two individual demand curves (with X on the horizontal axis,PX on the vertical axis) for the case I1 = 1000, I2 = 1000, and PY = 10.

c) Using these individual demand curves, construct the market demand curve for total X. What is the algebraic equation for this curve?

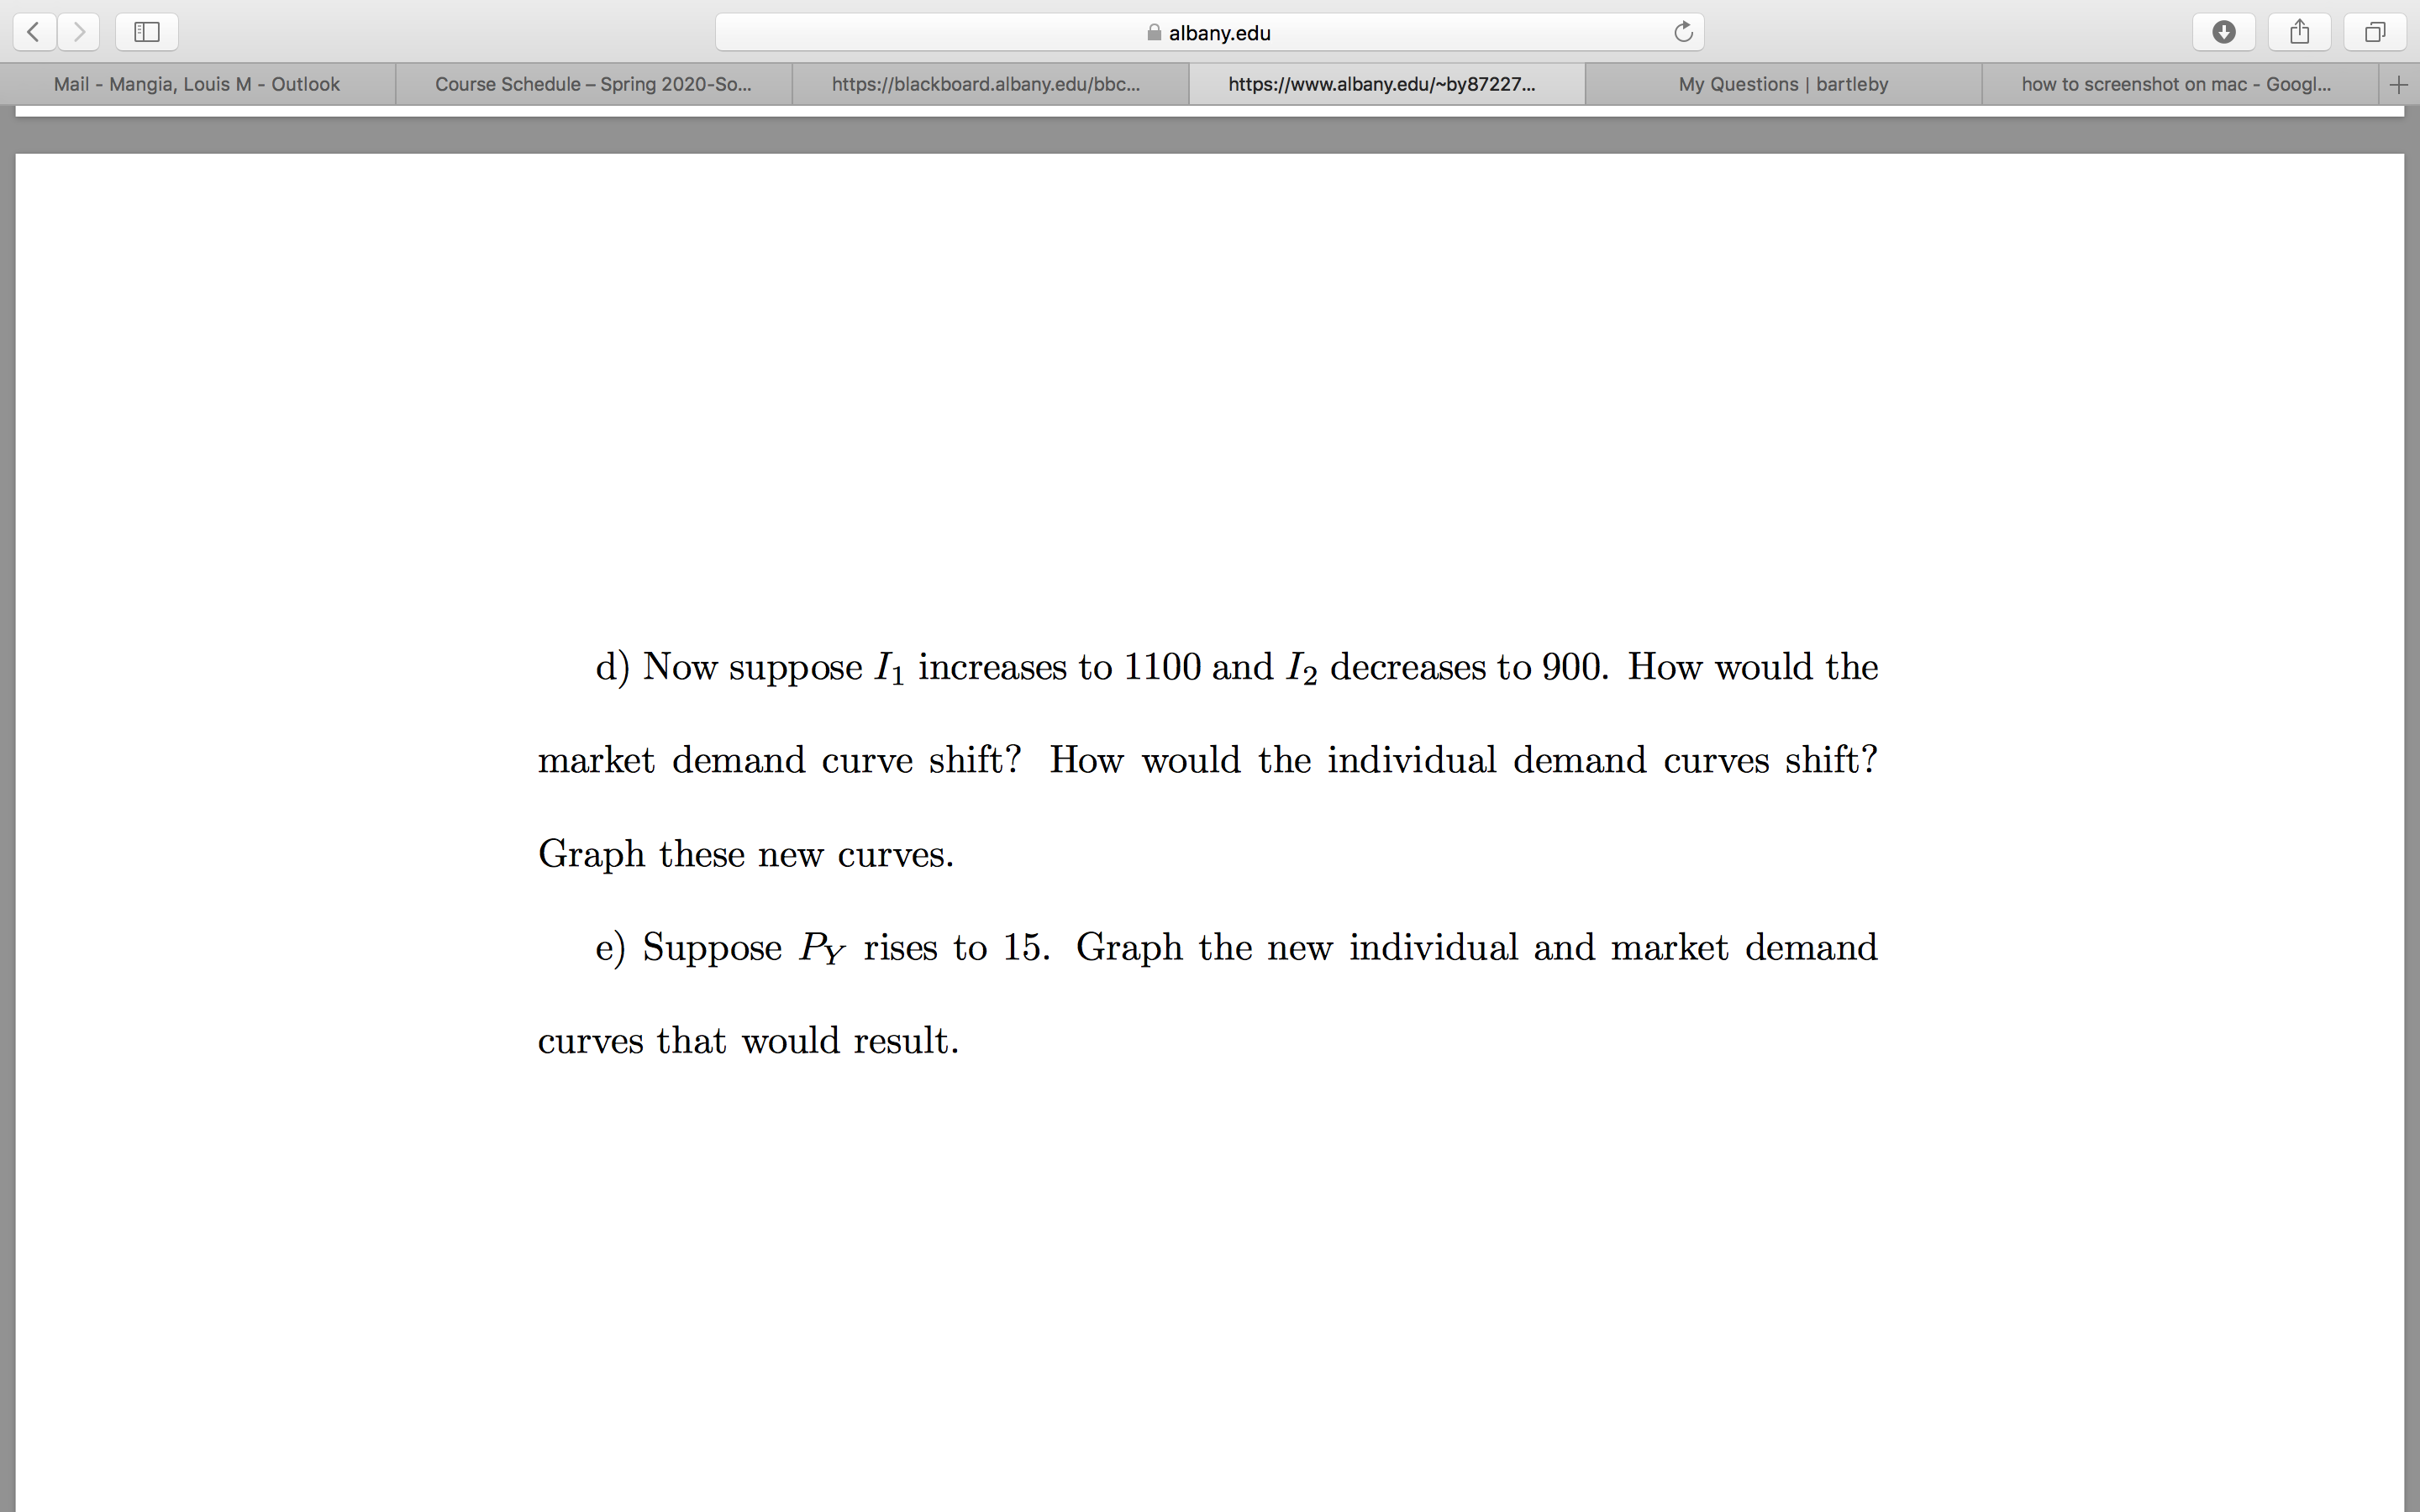
d) Now suppose I1 increases to 1100 and I2 decreases to 900. How would the market demand curve shift? How would the individual demand curves shift? Graph these new curves.

e) Suppose PY rises to 15. Graph the new individual and market demand curves that would result.
albany.edu
how to screenshot on mac - Googl...
Course Schedule – Spring 2020-So...
Mail - Mangia, Louis M - Outlook
https://blackboard.albany.edu/bbc..
https://www.albany.edu/~by87227..
My Questions | bartleby
5. Suppose the quantity of good X demanded by individual 1 is given by
X1 = 10 – 2Px+0.0111 +0.4Py
and the quantity of X demanded by individual 2 is
X2 = 5 – Px +0.0212 + 0.2Py
a) What is the market demand function for total X (= X1+X2) as a function
of Px, I1, I2, and Py.
b) Graph the two individual demand curves (with X on the horizontal axis,
=
= 1000, and Py = 10.
Px on the vertical axis) for the case I1
1000, I2
6.
c) Using these individual demand curves, construct the market demand curve
for total X. What is the algebraic equation for this curve?
Transcribed Image Text:albany.edu how to screenshot on mac - Googl... Course Schedule – Spring 2020-So... Mail - Mangia, Louis M - Outlook https://blackboard.albany.edu/bbc.. https://www.albany.edu/~by87227.. My Questions | bartleby 5. Suppose the quantity of good X demanded by individual 1 is given by X1 = 10 – 2Px+0.0111 +0.4Py and the quantity of X demanded by individual 2 is X2 = 5 – Px +0.0212 + 0.2Py a) What is the market demand function for total X (= X1+X2) as a function of Px, I1, I2, and Py. b) Graph the two individual demand curves (with X on the horizontal axis, = = 1000, and Py = 10. Px on the vertical axis) for the case I1 1000, I2 6. c) Using these individual demand curves, construct the market demand curve for total X. What is the algebraic equation for this curve?
albany.edu
My Questions | bartleby
how to screenshot on mac - Googl...
Mail - Mangia, Louis M - Outlook
Course Schedule – Spring 2020-So...
https://blackboard.albany.edu/bbc..
https://www.albany.edu/~by87227..
d) Now suppose I1 increases to 1100 and I2 decreases to 900. How would the
market demand curve shift? How would the individual demand curves shift?
Graph these new curves.
e) Suppose Py rises to 15. Graph the new individual and market demand
curves that would result.
Transcribed Image Text:albany.edu My Questions | bartleby how to screenshot on mac - Googl... Mail - Mangia, Louis M - Outlook Course Schedule – Spring 2020-So... https://blackboard.albany.edu/bbc.. https://www.albany.edu/~by87227.. d) Now suppose I1 increases to 1100 and I2 decreases to 900. How would the market demand curve shift? How would the individual demand curves shift? Graph these new curves. e) Suppose Py rises to 15. Graph the new individual and market demand curves that would result.
Expert Solution
trending now

Trending now

This is a popular solution!

steps

Step by step

Solved in 4 steps with 6 images

Blurred answer
Knowledge Booster
Substitute Goods
Learn more about
Need a deep-dive on the concept behind this application? Look no further. Learn more about this topic, economics and related others by exploring similar questions and additional content below.
Similar questions
  • SEE MORE QUESTIONS
Recommended textbooks for you
Microeconomic Theory
Economics
ISBN:
9781337517942
Author:
NICHOLSON
Publisher:
Cengage
Microeconomics: Principles & Policy
Economics
ISBN:
9781337794992
Author:
William J. Baumol, Alan S. Blinder, John L. Solow
Publisher:
Cengage Learning