37.6% R Give Up? O Hint ment Score: Resources Chec on 5 of 15 <. In 2013, Prussia's aggregate demand curve was determined by the equation M +0= 4%. A change in aggregate demand means that in 2014, Prussia's aggregate demand curve was determined by the equation M +6= 7%. Using this information, draw Prussia's old and new dynamic aggregate demand curves on the graph. Which of the factors could have resulted in the change in 14 aggregate demand seen between 2013 and 2014? 13 O an improvement in technology 12 11 an increase in imports 10 a decrease in oil prices 8. AD 2013 O higher consumer confidence 7. 5. -3 -2 -1 3. 6. 10 Real GDP growth rate F12 AD 2014 4. 6, 4. Inflation rate
37.6% R Give Up? O Hint ment Score: Resources Chec on 5 of 15 <. In 2013, Prussia's aggregate demand curve was determined by the equation M +0= 4%. A change in aggregate demand means that in 2014, Prussia's aggregate demand curve was determined by the equation M +6= 7%. Using this information, draw Prussia's old and new dynamic aggregate demand curves on the graph. Which of the factors could have resulted in the change in 14 aggregate demand seen between 2013 and 2014? 13 O an improvement in technology 12 11 an increase in imports 10 a decrease in oil prices 8. AD 2013 O higher consumer confidence 7. 5. -3 -2 -1 3. 6. 10 Real GDP growth rate F12 AD 2014 4. 6, 4. Inflation rate

Chapter14: Aggregate Demand And Supply
Section14.A: The Self Correcting Aggregate Demand And Supply Model
Problem 1SQP

Related questions
Question
100%
Transcribed Image Text:37.6%
R Give Up?
O Hint
ment Score:
Resources
Chec
on 5 of 15
<.
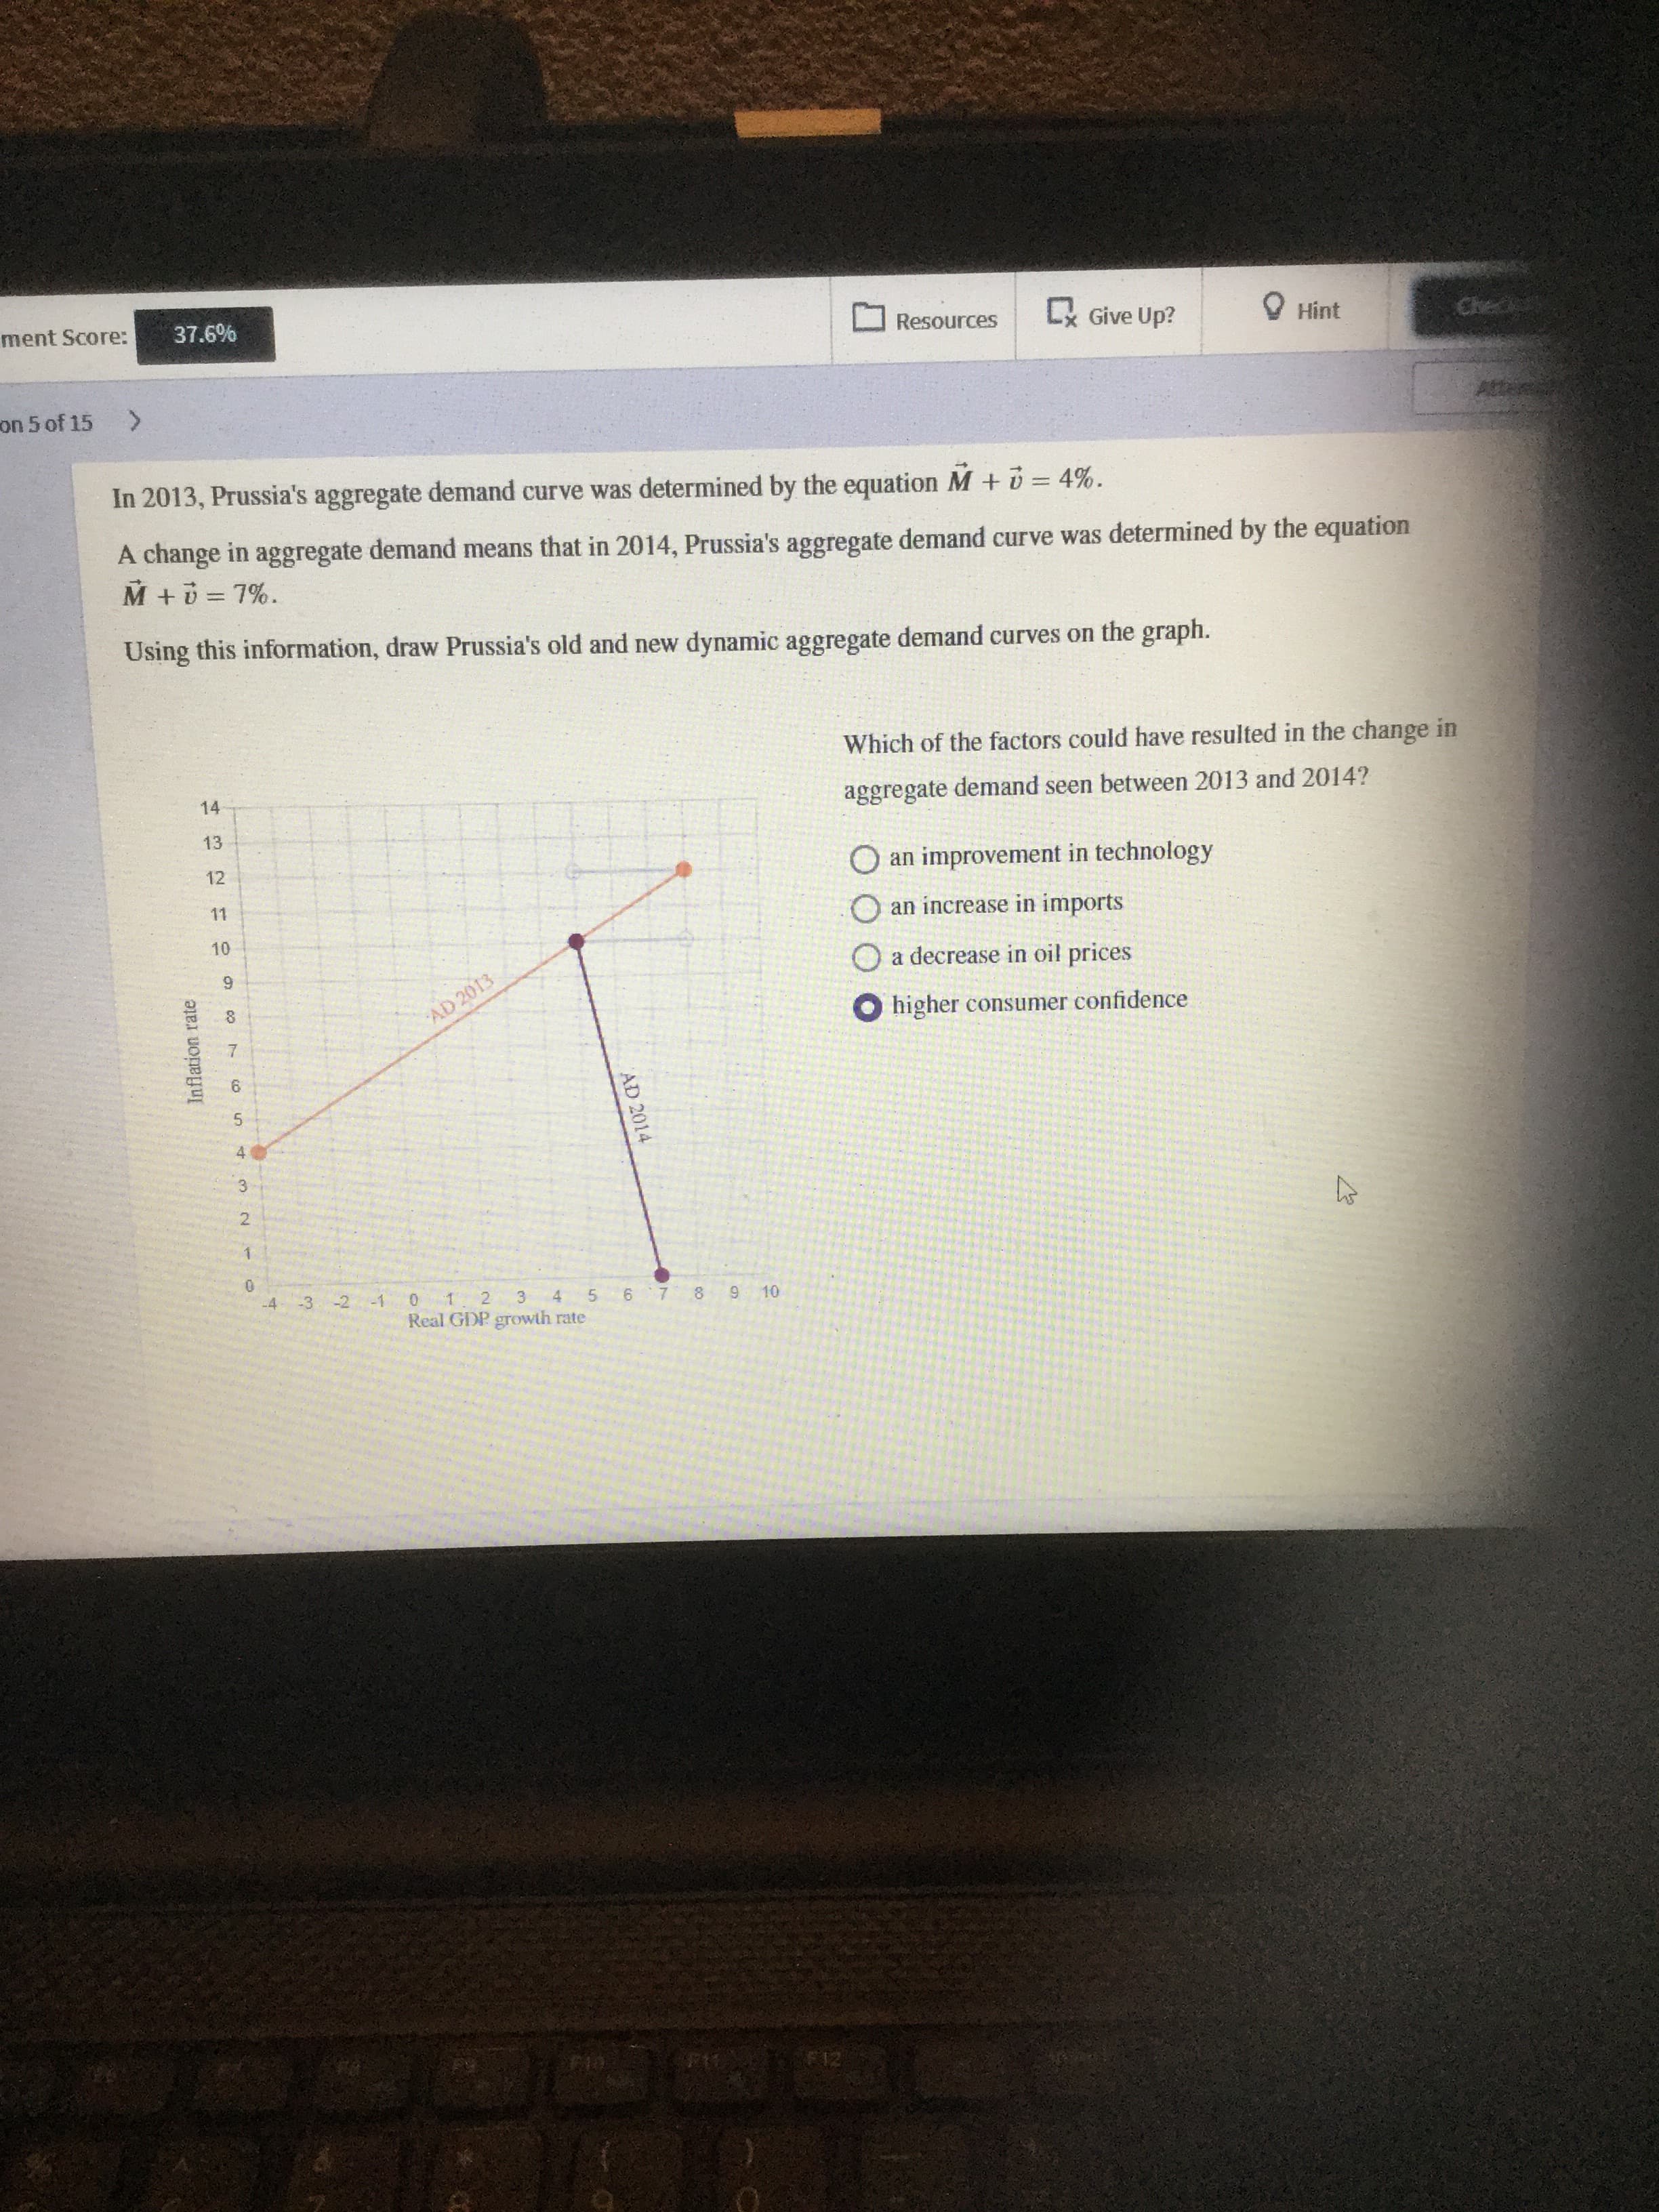
In 2013, Prussia's aggregate demand curve was determined by the equation M +0= 4%.
A change in aggregate demand means that in 2014, Prussia's aggregate demand curve was determined by the equation
M +6= 7%.
Using this information, draw Prussia's old and new dynamic aggregate demand curves on the graph.
Which of the factors could have resulted in the change in
14
aggregate demand seen between 2013 and 2014?
13
O an improvement in technology
12
11
an increase in imports
10
a decrease in oil prices
8.
AD 2013
O higher consumer confidence
7.
5.
-3
-2
-1
3.
6.
10
Real GDP growth rate
F12
AD 2014
4.
6,
4.
Inflation rate
Expert Solution
This question has been solved!
Explore an expertly crafted, step-by-step solution for a thorough understanding of key concepts.

This is a popular solution!

Trending now
This is a popular solution!

Step by step
Solved in 2 steps with 4 images

Recommended textbooks for you

Economics: Private and Public Choice (MindTap Cou…
Economics
ISBN:
9781305506725
Author:
James D. Gwartney, Richard L. Stroup, Russell S. Sobel, David A. Macpherson
Publisher:
Cengage Learning

Macroeconomics: Private and Public Choice (MindTa…
Economics
ISBN:
9781305506756
Author:
James D. Gwartney, Richard L. Stroup, Russell S. Sobel, David A. Macpherson
Publisher:
Cengage Learning
Economics: Private and Public Choice (MindTap Cou…
Economics
ISBN:
9781305506725
Author:
James D. Gwartney, Richard L. Stroup, Russell S. Sobel, David A. Macpherson
Publisher:
Cengage Learning
Macroeconomics: Private and Public Choice (MindTa…
Economics
ISBN:
9781305506756
Author:
James D. Gwartney, Richard L. Stroup, Russell S. Sobel, David A. Macpherson
Publisher:
Cengage Learning


Brief Principles of Macroeconomics (MindTap Cours…
Economics
ISBN:
9781337091985
Author:
N. Gregory Mankiw
Publisher:
Cengage Learning