Aleyla, an educator, would like to investigate whether students’ IQ have an effect on their exam scores. She also wants to determine if teaching strategy is associated with whether students pass or fail in the exam (exam result). She then randomly selected twenty students and conducted an IQ test. Further, she randomly assigned them to the two teaching strategies. The students’ exam scores were recorded. 1. What can you say about the relationship between IQ and exam scores? Coefficient: __ = ___________ There is a _______ _______ _______ relationship between IQ and exam scores. 2. Test at 5% level of significance if exam scores are linearly associated with IQ. Ho: (in symbols) _____ ; (in words) ____________________________________ Ha: (in symbols) _____ ; (in words) ____________________________________ p-value: ___________ Decision: ________________________________ Conclusion: At alpha = 0.05, ________________________________________________________________ ________________________________________________________________ 3. Aleyla also wants to know if it is possible to predict the exam scores of students based on IQ. Create a model to do this and interpret its components. Assume all the necessary requirements for a regression analysis were met. Model: ________________________________________ Interpret the following values: Regression constant: ______________________________________________ ________________________________________________________________ Regression coefficient: ?"1 = ______ where ?"1 - coefficient for variable ‘IQ’ The exam scores ________ (increase/decrease) by ________ for every one unit increase in IQ. R-squared: _________ Interpretation:_____________________________


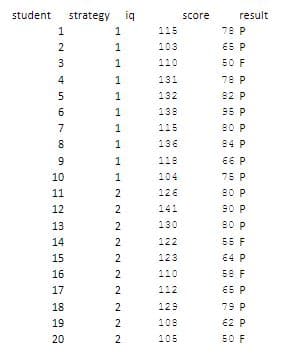
Aleyla, an educator, would like to investigate whether students’ IQ have an effect on their exam scores. She also wants to determine if teaching strategy is associated with whether students pass or fail in the exam (exam result). She then randomly selected twenty students and conducted an IQ test. Further, she randomly assigned them to
the two teaching strategies. The students’ exam scores were recorded.
1. What can you say about the relationship between IQ and exam scores?
Coefficient: __ = ___________
There is a _______ _______ _______ relationship between IQ and exam scores.
2. Test at 5% level of significance if exam scores are linearly associated with IQ.
Ho: (in symbols) _____ ; (in words) ____________________________________
Ha: (in symbols) _____ ; (in words) ____________________________________
p-value: ___________
Decision: ________________________________
Conclusion: At alpha = 0.05, ________________________________________________________________ ________________________________________________________________
3. Aleyla also wants to know if it is possible to predict the exam scores of students based on IQ. Create a model to do this and interpret its components. Assume all the necessary requirements for a
Model: ________________________________________
Interpret the following values:
Regression constant: ______________________________________________ ________________________________________________________________
Regression coefficient: ?"1 = ______ where ?"1 - coefficient for variable ‘IQ’
The exam scores ________ (increase/decrease) by ________ for every one unit increase in IQ.
R-squared: _________
Interpretation:_____________________________________________________________________________________________________________________
![Doornik-Hansen Test (Exam Scores vs IQ)
DH: 3.808173 p-value:
0.4325889
Correlation Coefficients between Exam Scores and IQ
Pearson's r
Spearman's
Kendall's t=
= 0.7403599
0.6021854
= 0.7680134
Ha: not equal to 0
Ha: not equal to 0
Ha: not equal to 0
p-value = 0.0001894
p-value = 0.0000768
Expected Frequencies of Strategy vs Exam Result
p-value = 0.0002619
strategy F P
128
228
RcmdrMsg: [22] WARNING:
RcmdrMsg- 2 expected frequencies are less than 5
Test of Independence between Strategy and Exam Result
Chi-Square p-
value = 0.2636
Fisher's Exact Test
p-value = 0.582
Regression of Exam Scores on IQ
Coefficients:
(Intercept) -23.9831
0.7955
Estimate Std. Error t value Pr(>|t|)
28.5950 -1.165 0.259419
4.673 0.000189 ***
0.1703
signif. codes:
0.001 *** 0.01
0.05
Residual standard error: 8.92 on 18 degrees of freedom
Multiple R-squared: 0.5481,
F-statistic: 21.83 on 1 and 18 DF, p-value: 0.0001894
Adjusted R-squared: e.523](/v2/_next/image?url=https%3A%2F%2Fcontent.bartleby.com%2Fqna-images%2Fquestion%2F2f56f0ba-0f12-4b77-9e95-d1b6584f528f%2Fa89b9103-8173-4abd-b59f-15bf4b02501d%2Fx1vnjy4_processed.jpeg&w=3840&q=75)

Step by step
Solved in 4 steps

