Based on the scatter plot above, answer the following: 1. Can you describe the relationship between the temperature and the number of ice creams sold? 2. What could we do if we wanted to be more confident about our description of this relationship?
Based on the scatter plot above, answer the following: 1. Can you describe the relationship between the temperature and the number of ice creams sold? 2. What could we do if we wanted to be more confident about our description of this relationship?

Chapter3: Polynomial Functions
Section3.5: Mathematical Modeling And Variation
Problem 71E

Related questions
Question
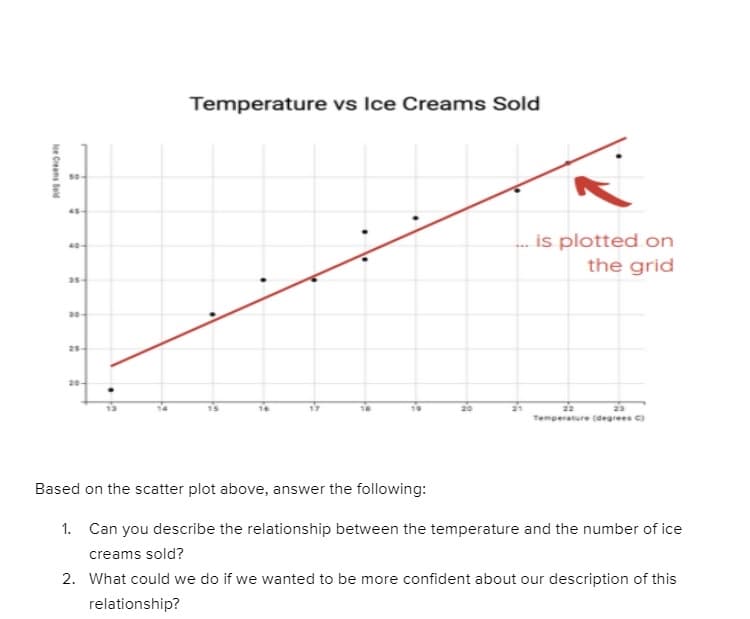
Transcribed Image Text:Temperature vs Ice Creams Sold
is plotted on
the grid
40-
25-
Temperature cdegrees
Based on the scatter plot above, answer the following:
1. Can you describe the relationship between the temperature and the number of ice
creams sold?
2. What could we do if we wanted to be more confident about our description of this
relationship?
lce Creams Seld
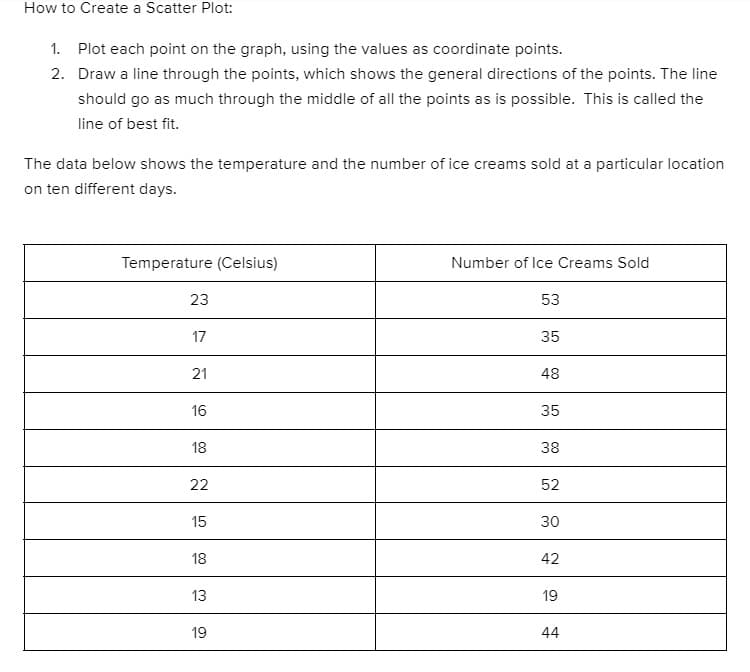
Transcribed Image Text:How to Create a Scatter Plot:
1. Plot each point on the graph, using the values as coordinate points.
2. Draw a line through the points, which shows the general directions of the points. The line
should go as much through the middle of all the points as is possible. This is called the
line of best fit.
The data below shows the temperature and the number of ice creams sold at a particular location
on ten different days.
Temperature (Celsius)
Number of Ice Creams Sold
23
53
17
35
21
48
16
35
18
38
22
52
15
30
18
42
13
19
19
44
Expert Solution
This question has been solved!
Explore an expertly crafted, step-by-step solution for a thorough understanding of key concepts.

Step by step
Solved in 2 steps

Recommended textbooks for you

Intermediate Algebra
Algebra
ISBN:
9781285195728
Author:
Jerome E. Kaufmann, Karen L. Schwitters
Publisher:
Cengage Learning

Trigonometry (MindTap Course List)
Trigonometry
ISBN:
9781337278461
Author:
Ron Larson
Publisher:
Cengage Learning
Intermediate Algebra
Algebra
ISBN:
9781285195728
Author:
Jerome E. Kaufmann, Karen L. Schwitters
Publisher:
Cengage Learning
Trigonometry (MindTap Course List)
Trigonometry
ISBN:
9781337278461
Author:
Ron Larson
Publisher:
Cengage Learning

Holt Mcdougal Larson Pre-algebra: Student Edition…
Algebra
ISBN:
9780547587776
Author:
HOLT MCDOUGAL
Publisher:
HOLT MCDOUGAL

Glencoe Algebra 1, Student Edition, 9780079039897…
Algebra
ISBN:
9780079039897
Author:
Carter
Publisher:
McGraw Hill

Big Ideas Math A Bridge To Success Algebra 1: Stu…
Algebra
ISBN:
9781680331141
Author:
HOUGHTON MIFFLIN HARCOURT
Publisher:
Houghton Mifflin Harcourt