ALFRED l 110 100 Jan 1992 Employment Level: Less than a High 12,266.0 (12.4 % ) School Diploma, 25 years and over Vintage: 2017-11-03: 90 80 70 Employment Level: High School Graduates, No College, 25 years and over Vintage: 2017-11-03: Employment Level: Some College or 24,962.0 (25.2 6) Associate Degree, 25 years and over Vintage: 2017-11-03: Employment Level: Bachelor's Degree and Higher, 25 years and over Vintage: 2017-11-03: 35,237.0 (35.5%) 60 50 40 30 26,776.0 (27.0%) 20 10 0 1995 2000 2005 2010 2015 2000 Percent ALFRED l Jan 2017 Employment Level: Less than a High School Diploma, 25 years and over Vintage: 2017-11-03: 9,725.0 (7.3%) 110 100 Employment Level: High School Graduates, No College, 25 years and over Vintage: 2017-11-03: Employment Level: Some College or 36,563.0 (27.5% ) Associate Degree, 25 years and over Vintage: 2017-11-03: Employment Level: Bachelor's Degree and Higher, 25 years and over Vintage: 2017-11-03: 33,580.0 (25.3%) 90 80 70 60 50 52,925.0 (39.9%) 40 30 20 10 2000 2010 1995 2005 2015 2000 Source: U.S. Bureau of Labor Statistics Percent
ALFRED l 110 100 Jan 1992 Employment Level: Less than a High 12,266.0 (12.4 % ) School Diploma, 25 years and over Vintage: 2017-11-03: 90 80 70 Employment Level: High School Graduates, No College, 25 years and over Vintage: 2017-11-03: Employment Level: Some College or 24,962.0 (25.2 6) Associate Degree, 25 years and over Vintage: 2017-11-03: Employment Level: Bachelor's Degree and Higher, 25 years and over Vintage: 2017-11-03: 35,237.0 (35.5%) 60 50 40 30 26,776.0 (27.0%) 20 10 0 1995 2000 2005 2010 2015 2000 Percent ALFRED l Jan 2017 Employment Level: Less than a High School Diploma, 25 years and over Vintage: 2017-11-03: 9,725.0 (7.3%) 110 100 Employment Level: High School Graduates, No College, 25 years and over Vintage: 2017-11-03: Employment Level: Some College or 36,563.0 (27.5% ) Associate Degree, 25 years and over Vintage: 2017-11-03: Employment Level: Bachelor's Degree and Higher, 25 years and over Vintage: 2017-11-03: 33,580.0 (25.3%) 90 80 70 60 50 52,925.0 (39.9%) 40 30 20 10 2000 2010 1995 2005 2015 2000 Source: U.S. Bureau of Labor Statistics Percent

Chapter11: Labor Markets
Section: Chapter Questions
Problem 1SQ

Related questions
Question
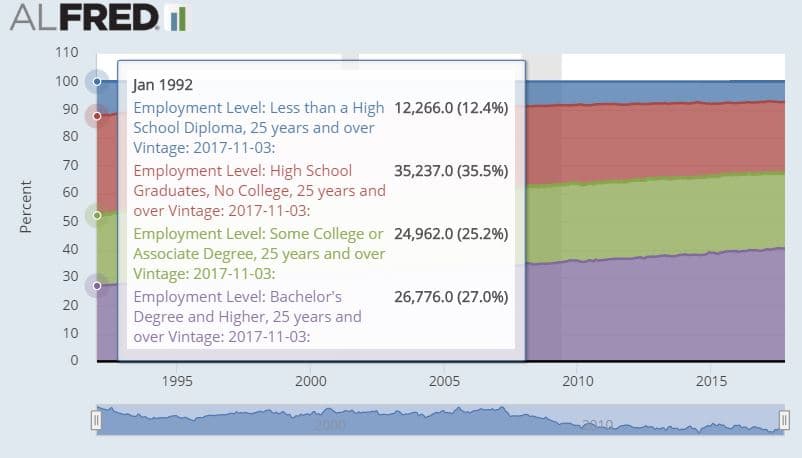
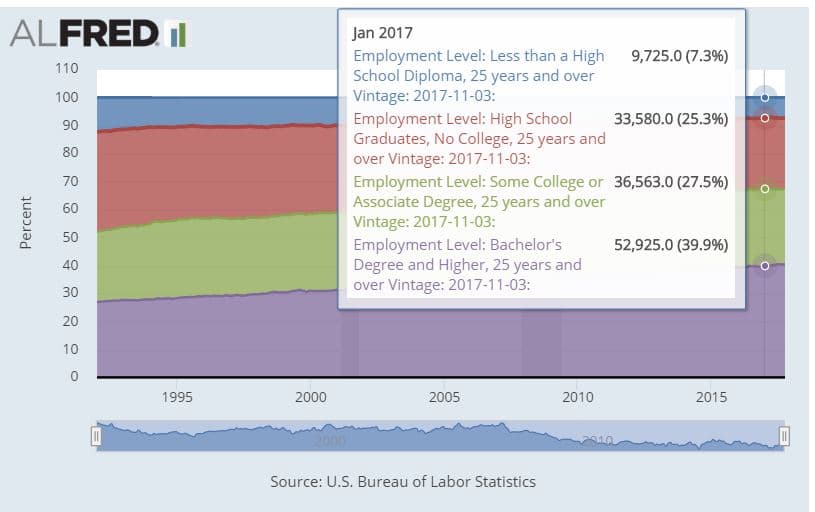
Calculate the change in the share of employment by education levels between January 1992 and January 2017.
Include a negative sign to indicate a decrease. Round answers to one place after the decimal.
1)Less than a high school diploma__________percentage points
2)High school diploma only_________percentage points
3)Some college_________percentage points
4)College graduate_________percentage points
Transcribed Image Text:ALFRED l
110
100
Jan 1992
Employment Level: Less than a High 12,266.0 (12.4 % )
School Diploma, 25 years and over
Vintage: 2017-11-03:
90
80
70
Employment Level: High School
Graduates, No College, 25 years and
over Vintage: 2017-11-03:
Employment Level: Some College or 24,962.0 (25.2 6)
Associate Degree, 25 years and over
Vintage: 2017-11-03:
Employment Level: Bachelor's
Degree and Higher, 25 years and
over Vintage: 2017-11-03:
35,237.0 (35.5%)
60
50
40
30
26,776.0 (27.0%)
20
10
0
1995
2000
2005
2010
2015
2000
Percent
Transcribed Image Text:ALFRED l
Jan 2017
Employment Level: Less than a High
School Diploma, 25 years and over
Vintage: 2017-11-03:
9,725.0 (7.3%)
110
100
Employment Level: High School
Graduates, No College, 25 years and
over Vintage: 2017-11-03:
Employment Level: Some College or 36,563.0 (27.5% )
Associate Degree, 25 years and over
Vintage: 2017-11-03:
Employment Level: Bachelor's
Degree and Higher, 25 years and
over Vintage: 2017-11-03:
33,580.0 (25.3%)
90
80
70
60
50
52,925.0 (39.9%)
40
30
20
10
2000
2010
1995
2005
2015
2000
Source: U.S. Bureau of Labor Statistics
Percent
Expert Solution
This question has been solved!
Explore an expertly crafted, step-by-step solution for a thorough understanding of key concepts.

This is a popular solution!

Trending now
This is a popular solution!

Step by step
Solved in 5 steps with 5 images

Knowledge Booster


Learn more about
Need a deep-dive on the concept behind this application? Look no further. Learn more about this topic, economics and related others by exploring similar questions and additional content below.Recommended textbooks for you

