Algebra I Practice with Outliers MathBitaNotebook.com e Can Doten Practice Page Directions: These quetiona deal wh outliers 1. Given data set: -3, 5, 10, 12, 14, 18, 24, 26, 49, 60 Which of the following statements is true regarding this data? Choose: O The value -3 is the only outlier. O The value 60 is the only outlier. O No outliers exist. O Multiple outliers exist. 2. The following temperatures were recorded (in F") each day for two weeks. 82, 72, 83, 75, 80, 78, 82, 73, 60, 79, 80, 78, 83, 81 ka) What is the outlier in this data, if one exists? Choose: O 84 O 83 O 60 O no outliers kb) What is the mean for this set of data? o 75 Choose: O 77.6 O 78.9 o 79.5 kc) What is the mean for this set of data, if the outlier is removed? Choose: o 75 o 7.6 O 77.6 o 78.9 O 79.5 kd) Which of the box plots gives the best representation of this data set? Choose: o Box A O Box B o Both give the same information. Box B O Neither represent this data. Box A . Mandcom 50 60 70 80 3. The data set shown below has an outlier. Determine the outlier and then answer the questions as to what happens to the median, mean, mode. range and standard deviation when the outlier is removed. Data: 29, 19, 35, 27, 21, 48, 23, 12, 24, 26, 20, 28, 30, 22, 19, 32, 22 If the outlier is excluded, what happens to: Increase Decrease No effect the median? the mean? the mode? the range? the standard deviation? 4. Which measure of central tendency is most affected by outliers?
Algebra I Practice with Outliers MathBitaNotebook.com e Can Doten Practice Page Directions: These quetiona deal wh outliers 1. Given data set: -3, 5, 10, 12, 14, 18, 24, 26, 49, 60 Which of the following statements is true regarding this data? Choose: O The value -3 is the only outlier. O The value 60 is the only outlier. O No outliers exist. O Multiple outliers exist. 2. The following temperatures were recorded (in F") each day for two weeks. 82, 72, 83, 75, 80, 78, 82, 73, 60, 79, 80, 78, 83, 81 ka) What is the outlier in this data, if one exists? Choose: O 84 O 83 O 60 O no outliers kb) What is the mean for this set of data? o 75 Choose: O 77.6 O 78.9 o 79.5 kc) What is the mean for this set of data, if the outlier is removed? Choose: o 75 o 7.6 O 77.6 o 78.9 O 79.5 kd) Which of the box plots gives the best representation of this data set? Choose: o Box A O Box B o Both give the same information. Box B O Neither represent this data. Box A . Mandcom 50 60 70 80 3. The data set shown below has an outlier. Determine the outlier and then answer the questions as to what happens to the median, mean, mode. range and standard deviation when the outlier is removed. Data: 29, 19, 35, 27, 21, 48, 23, 12, 24, 26, 20, 28, 30, 22, 19, 32, 22 If the outlier is excluded, what happens to: Increase Decrease No effect the median? the mean? the mode? the range? the standard deviation? 4. Which measure of central tendency is most affected by outliers?

Glencoe Algebra 1, Student Edition, 9780079039897, 0079039898, 2018
18th Edition
ISBN:9780079039897
Author:Carter
Publisher:Carter
Chapter10: Statistics
Section10.5: Comparing Sets Of Data
Problem 26PFA

Related questions
Question
Do questions 1,2 and 3
This isn’t graded.
Transcribed Image Text:Practice with Outliers
MathBitsNotebook.com
Algebra 1
Zosical Oe AedalO Maa Teache Rees
Tem of he Contacet Persen: Denna Retert
Practice Page
Directions: These questiona deal with outliers
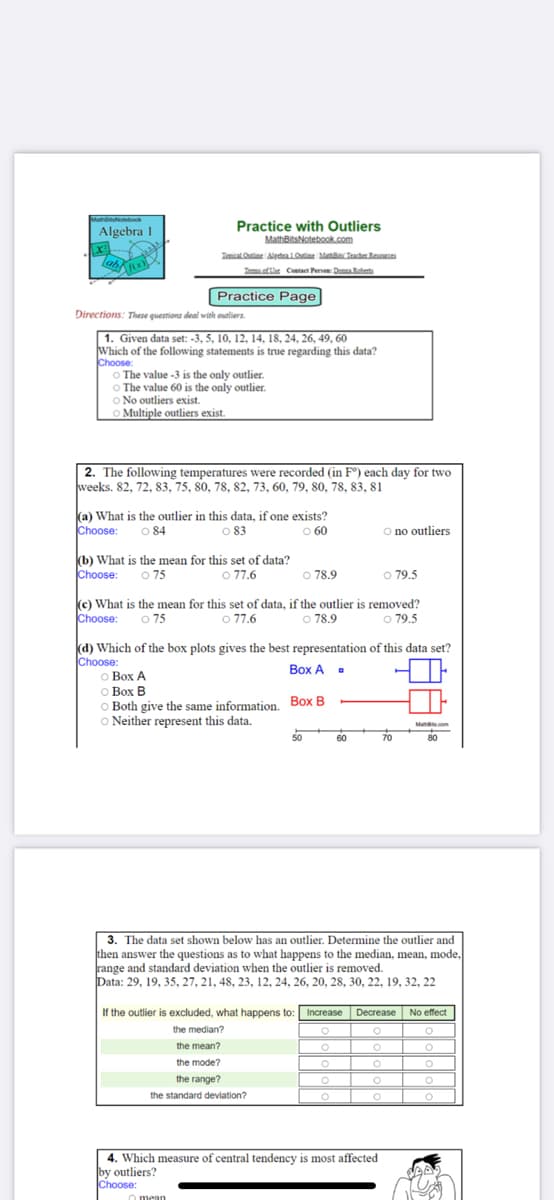
|1. Given data set: -3, 5, 10, 12, 14, 18, 24, 26, 49, 60
Which of the following statements is true regarding this data?
Choose:
O The value -3 is the only outlier.
O The value 60 is the only outlier.
O No outliers exist.
O Multiple outliers exist.
2. The following temperatures were recorded (in F®) each day for two
weeks. 82, 72, 83, 75, 80, 78, 82, 73, 60, 79, 80, 78, 83, 81
Ka) What is the outlier in this data, if one exists?
O 84
Choose:
O no outliers
83
O 60
(b) What is the mean for this set of data?
Choose: o 75
O 77.6
o 79.5
O 78.9
ke) What is the mean for this set of data, if the outlier is removed?
o 77.6
Choose:
o 75
o 78.9
o 79.5
(d) Which of the box plots gives the best representation of this data set?
Choose:
o Box A
O Box B
O Both give the same information. Box B
O Neither represent this data.
Box A .
Mare.com
80
50
60
70
3. The data set shown below has an outlier. Determine the outlier and
then answer the questions as to what happens to the median, mean, mode,
range and standard deviation when the outlier is removed.
Data: 29, 19, 35, 27, 21, 48, 23, 12, 24, 26, 20, 28, 30, 22, 19, 32, 22
If the outlier is excluded, what happens to: Increase
Decrease
No effect
the median?
the mean?
O
the mode?
O
O
the range?
the standard deviation?
4. Which measure of central tendency is most affected
by outliers?
Choose:
o mean
Expert Solution
This question has been solved!
Explore an expertly crafted, step-by-step solution for a thorough understanding of key concepts.

This is a popular solution!

Trending now
This is a popular solution!

Step by step
Solved in 3 steps

Recommended textbooks for you
Glencoe Algebra 1, Student Edition, 9780079039897…
Algebra
ISBN:
9780079039897
Author:
Carter
Publisher:
McGraw Hill

Holt Mcdougal Larson Pre-algebra: Student Edition…
Algebra
ISBN:
9780547587776
Author:
HOLT MCDOUGAL
Publisher:
HOLT MCDOUGAL
Glencoe Algebra 1, Student Edition, 9780079039897…
Algebra
ISBN:
9780079039897
Author:
Carter
Publisher:
McGraw Hill
Holt Mcdougal Larson Pre-algebra: Student Edition…
Algebra
ISBN:
9780547587776
Author:
HOLT MCDOUGAL
Publisher:
HOLT MCDOUGAL