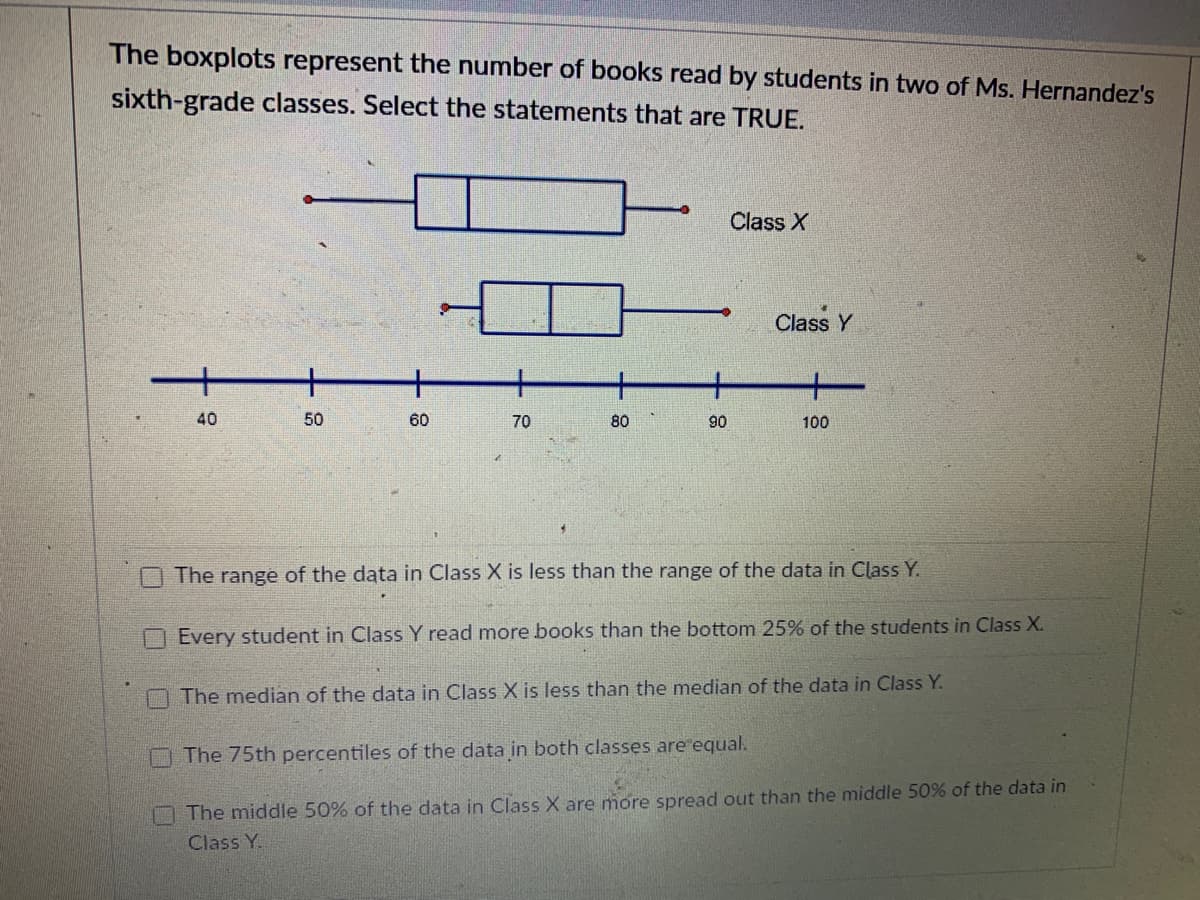
The boxplots represent the number of books read by students in two of Ms. Hernandez's sixth-grade classes. Select the statements that are TRUE. Class X Class Y + 40 50 60 70 80 90 100 The range of the data in Class X is less than the range of the data in Class Y. Every student in Class Y read more books than the bottom 25% of the students in Class X. The median of the data in Class X is less than the median of the data in Class Y. The 75th percentiles of the data in both classes are equal. OThe middle 50% of the data in Class X are more spread out than the middle 50% of the data in Class Y.


Correlation
Correlation defines a relationship between two independent variables. It tells the degree to which variables move in relation to each other. When two sets of data are related to each other, there is a correlation between them.
Linear Correlation
A correlation is used to determine the relationships between numerical and categorical variables. In other words, it is an indicator of how things are connected to one another. The correlation analysis is the study of how variables are related.
Regression Analysis
Regression analysis is a statistical method in which it estimates the relationship between a dependent variable and one or more independent variable. In simple terms dependent variable is called as outcome variable and independent variable is called as predictors. Regression analysis is one of the methods to find the trends in data. The independent variable used in Regression analysis is named Predictor variable. It offers data of an associated dependent variable regarding a particular outcome.


Trending now
This is a popular solution!

Step by step
Solved in 2 steps with 1 images


