The following chart provides data that is widespread. Use this data to answer questions 11 through 14. Ages: 25 41 33 39 42 20 28 31 40 20 26 23 34 35 41 22 20 29 27 36 38 38 20 28 29 25 11) Determine the "classes" of uniform width to be used in order to create a histogram for the given data. Create five different classes with the first class starting with an age of 20. 12) Construct a Frequency Distribution (a tally chart) of the Ages given using the classes from question #11. 6 26 5200ga9 sih bib esrov ynem woh (8 13) Construct a Stem and Leaf Plot using the data given in the chart above. peo) (iog netraa 14) Create a Histogram illustrating the information provided in the chart above. Label the vertical axis and horizonta! axis accordingly (ag . Provide an appropriate title – be creative - for the histogram (@ T) Construct the histogram the
The following chart provides data that is widespread. Use this data to answer questions 11 through 14. Ages: 25 41 33 39 42 20 28 31 40 20 26 23 34 35 41 22 20 29 27 36 38 38 20 28 29 25 11) Determine the "classes" of uniform width to be used in order to create a histogram for the given data. Create five different classes with the first class starting with an age of 20. 12) Construct a Frequency Distribution (a tally chart) of the Ages given using the classes from question #11. 6 26 5200ga9 sih bib esrov ynem woh (8 13) Construct a Stem and Leaf Plot using the data given in the chart above. peo) (iog netraa 14) Create a Histogram illustrating the information provided in the chart above. Label the vertical axis and horizonta! axis accordingly (ag . Provide an appropriate title – be creative - for the histogram (@ T) Construct the histogram the

Glencoe Algebra 1, Student Edition, 9780079039897, 0079039898, 2018
18th Edition
ISBN:9780079039897
Author:Carter
Publisher:Carter
Chapter10: Statistics
Section10.6: Summarizing Categorical Data
Problem 4BGP

Related questions
Question
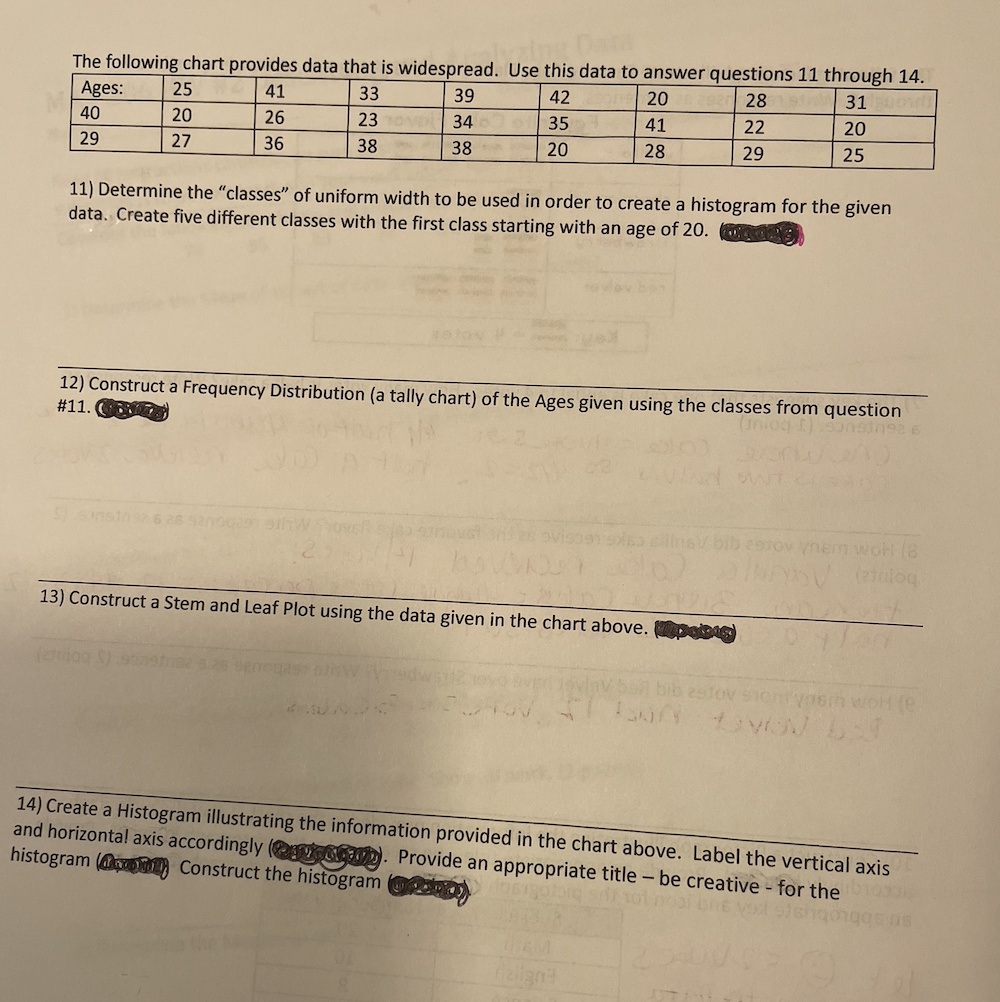
Transcribed Image Text:The following chart provides data that is widespread. Use this data to answer questions 11 through 14.
Ages:
25
41
33
39
42
20
28
31
40
20
26
23
34
35
41
22
20
29
27
36
38
38
20
28
29
25
11) Determine the "classes" of uniform width to be used in order to create a histogram for the given
data. Create five different classes with the first class starting with an age of 20.
12) Construct a Frequency Distribution (a tally chart) of the Ages given using the classes from question
#11.
6 26 5200ga9 sih
bib esrov ynem woh (8
13) Construct a Stem and Leaf Plot using the data given in the chart above. peo)
(iog netraa
14) Create a Histogram illustrating the information provided in the chart above. Label the vertical axis
and horizonta! axis accordingly (ag . Provide an appropriate title – be creative - for the
histogram (@ T) Construct the histogram
the
Expert Solution
This question has been solved!
Explore an expertly crafted, step-by-step solution for a thorough understanding of key concepts.

This is a popular solution!

Trending now
This is a popular solution!

Step by step
Solved in 4 steps with 2 images

Recommended textbooks for you
Glencoe Algebra 1, Student Edition, 9780079039897…
Algebra
ISBN:
9780079039897
Author:
Carter
Publisher:
McGraw Hill
Glencoe Algebra 1, Student Edition, 9780079039897…
Algebra
ISBN:
9780079039897
Author:
Carter
Publisher:
McGraw Hill