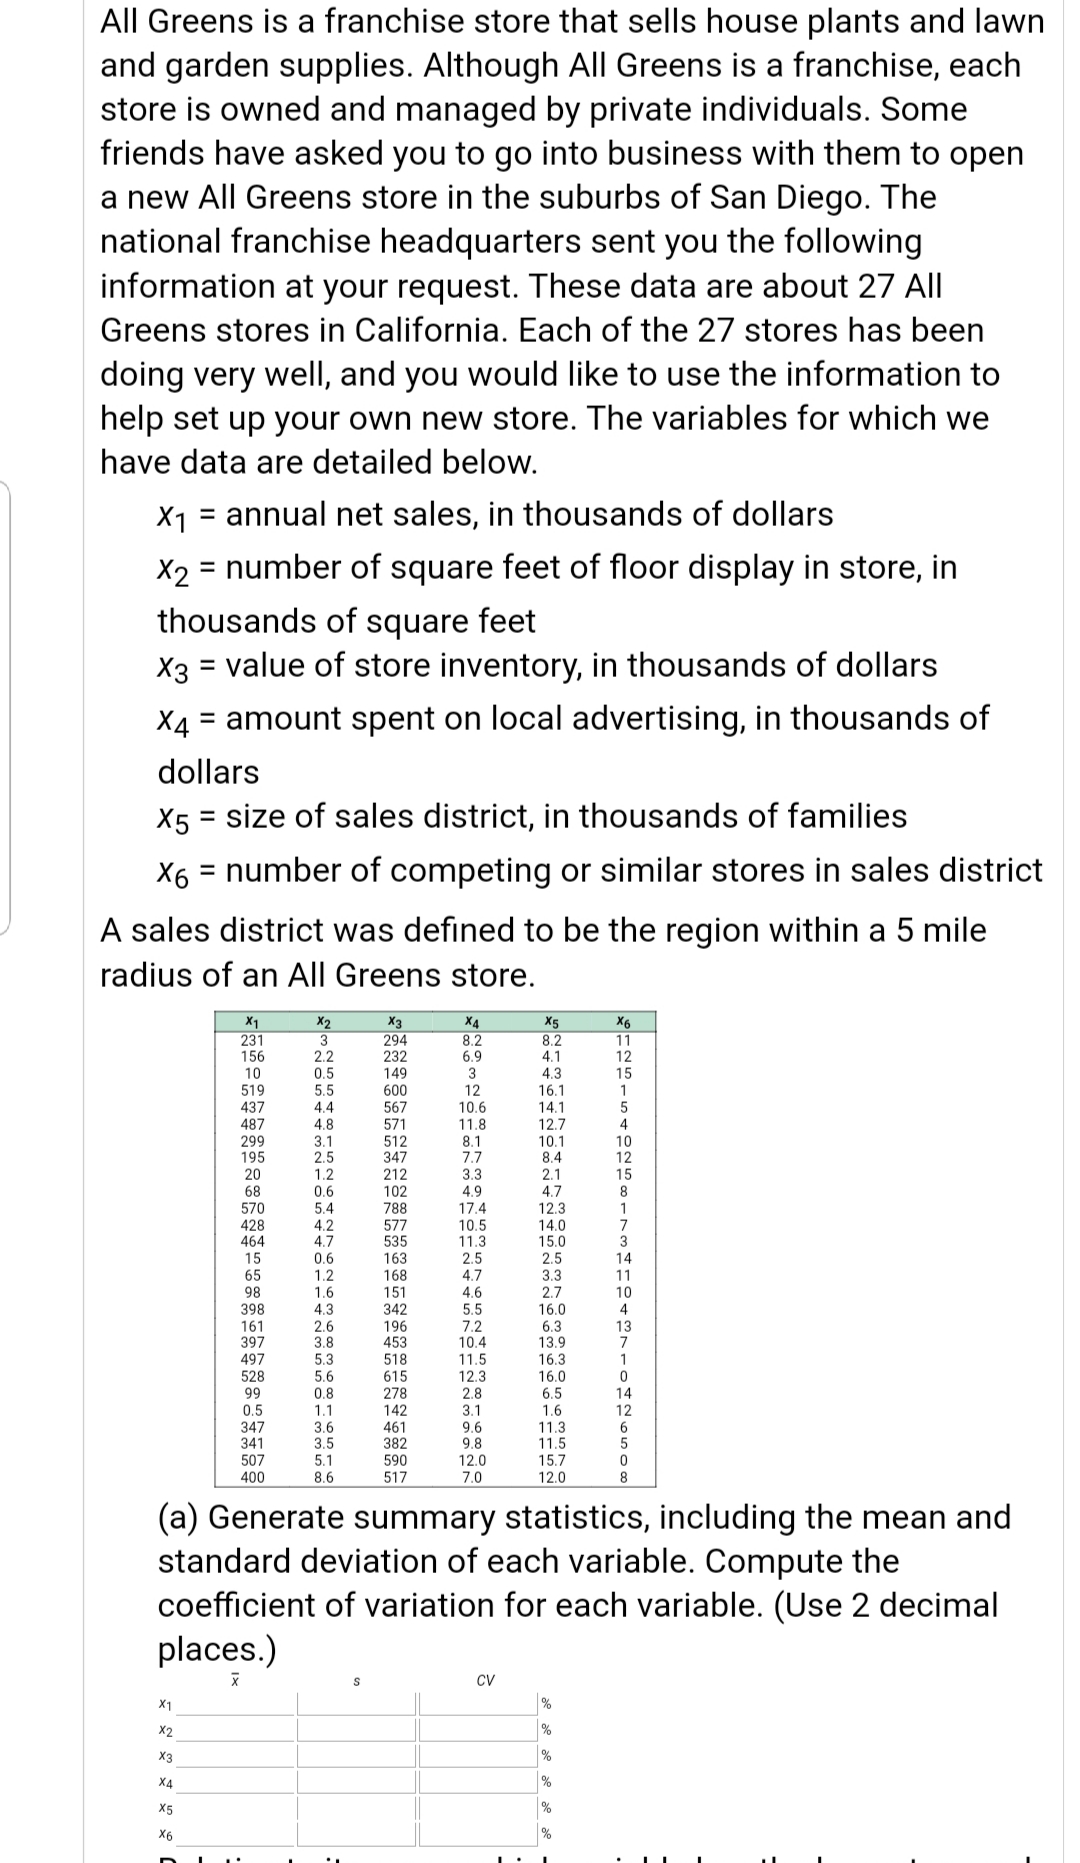
All Greens is a franchise store that sells house plants and lawn and garden supplies. Although All Greens is a franchise, each store is owned and managed by private individuals. Some friends have asked you to go into business with them to open a new All Greens store in the suburbs of San Diego. The national franchise headquarters sent you the following information at your request. These data are about 27 All Greens stores in California. Each of the 27 stores has been doing very well, and you would like to use the information to help set up your own new store. The variables for which we have data are detailed below. X1 = annual net sales, in thousands of dollars %3D X2 = number of square feet of floor display in store, in %3D thousands of square feet X3 = value of store inventory, in thousands of dollars X4 = amount spent on local advertising, in thousands of %3D dollars = size of sales district, in thousands of families = number of competing or similar stores in sales district A sales district was defined to be the region within a 5 mile radius of an All Greens store. X1 231 156 10 519 437 X2 X3 294 232 149 600 567 571 512 347 212 102 788 577 535 163 168 151 342 196 453 518 615 278 142 461 382 590 517 X4 8.2 6.9 3 12 10.6 11.8 8.1 7.7 3.3 4.9 17.4 10.5 11.3 2.5 4.7 4.6 5.5 7.2 10.4 11.5 12.3 2.8 3.1 9.6 9.8 12.0 7.0 X5 8.2 4.1 4.3 16.1 14.1 12.7 10.1 8.4 2.1 4.7 12.3 14.0 15.0 2.5 3.3 X6 11 12 15 1 2.2 0.5 5.5 4.4 487 4.8 3.1 2.5 1.2 0.6 299 195 20 68 570 428 464 15 65 98 10 12 15 8 1 5.4 4.2 4.7 0.6 1.2 1.6 4.3 2.6 3.8 5.3 5.6 0.8 1.1 3.6 3.5 5.1 8.6 7 3 14 11 10 2.7 16.0 6.3 13.9 16.3 16.0 6.5 1.6 11.3 11.5 15.7 12.0 398 161 397 497 528 99 4 13 7 1 14 0.5 347 341 507 400 12 6. 8. (a) Generate summary statistics, including the mean and standard deviation of each variable. Compute the coefficient of variation for each variable. (Use 2 decimal places.)
All Greens is a franchise store that sells house plants and lawn and garden supplies. Although All Greens is a franchise, each store is owned and managed by private individuals. Some friends have asked you to go into business with them to open a new All Greens store in the suburbs of San Diego. The national franchise headquarters sent you the following information at your request. These data are about 27 All Greens stores in California. Each of the 27 stores has been doing very well, and you would like to use the information to help set up your own new store. The variables for which we have data are detailed below. X1 = annual net sales, in thousands of dollars %3D X2 = number of square feet of floor display in store, in %3D thousands of square feet X3 = value of store inventory, in thousands of dollars X4 = amount spent on local advertising, in thousands of %3D dollars = size of sales district, in thousands of families = number of competing or similar stores in sales district A sales district was defined to be the region within a 5 mile radius of an All Greens store. X1 231 156 10 519 437 X2 X3 294 232 149 600 567 571 512 347 212 102 788 577 535 163 168 151 342 196 453 518 615 278 142 461 382 590 517 X4 8.2 6.9 3 12 10.6 11.8 8.1 7.7 3.3 4.9 17.4 10.5 11.3 2.5 4.7 4.6 5.5 7.2 10.4 11.5 12.3 2.8 3.1 9.6 9.8 12.0 7.0 X5 8.2 4.1 4.3 16.1 14.1 12.7 10.1 8.4 2.1 4.7 12.3 14.0 15.0 2.5 3.3 X6 11 12 15 1 2.2 0.5 5.5 4.4 487 4.8 3.1 2.5 1.2 0.6 299 195 20 68 570 428 464 15 65 98 10 12 15 8 1 5.4 4.2 4.7 0.6 1.2 1.6 4.3 2.6 3.8 5.3 5.6 0.8 1.1 3.6 3.5 5.1 8.6 7 3 14 11 10 2.7 16.0 6.3 13.9 16.3 16.0 6.5 1.6 11.3 11.5 15.7 12.0 398 161 397 497 528 99 4 13 7 1 14 0.5 347 341 507 400 12 6. 8. (a) Generate summary statistics, including the mean and standard deviation of each variable. Compute the coefficient of variation for each variable. (Use 2 decimal places.)

Glencoe Algebra 1, Student Edition, 9780079039897, 0079039898, 2018
18th Edition
ISBN:9780079039897
Author:Carter
Publisher:Carter
Chapter10: Statistics
Section: Chapter Questions
Problem 13PT

Related questions

Concept explainers
Contingency Table
A contingency table can be defined as the visual representation of the relationship between two or more categorical variables that can be evaluated and registered. It is a categorical version of the scatterplot, which is used to investigate the linear relationship between two variables. A contingency table is indeed a type of frequency distribution table that displays two variables at the same time.
Binomial Distribution
Binomial is an algebraic expression of the sum or the difference of two terms. Before knowing about binomial distribution, we must know about the binomial theorem.
Topic Video
Question
Transcribed Image Text:All Greens is a franchise store that sells house plants and lawn
and garden supplies. Although All Greens is a franchise, each
store is owned and managed by private individuals. Some
friends have asked you to go into business with them to open
a new All Greens store in the suburbs of San Diego. The
national franchise headquarters sent you the following
information at your request. These data are about 27 All
Greens stores in California. Each of the 27 stores has been
doing very well, and you would like to use the information to
help set up your own new store. The variables for which we
have data are detailed below.
X1 = annual net sales, in thousands of dollars
%3D
X2 = number of square feet of floor display in store, in
%3D
thousands of square feet
X3 = value of store inventory, in thousands of dollars
X4 = amount spent on local advertising, in thousands of
%3D
dollars
= size of sales district, in thousands of families
= number of competing or similar stores in sales district
A sales district was defined to be the region within a 5 mile
radius of an All Greens store.
X1
231
156
10
519
437
X2
X3
294
232
149
600
567
571
512
347
212
102
788
577
535
163
168
151
342
196
453
518
615
278
142
461
382
590
517
X4
8.2
6.9
3
12
10.6
11.8
8.1
7.7
3.3
4.9
17.4
10.5
11.3
2.5
4.7
4.6
5.5
7.2
10.4
11.5
12.3
2.8
3.1
9.6
9.8
12.0
7.0
X5
8.2
4.1
4.3
16.1
14.1
12.7
10.1
8.4
2.1
4.7
12.3
14.0
15.0
2.5
3.3
X6
11
12
15
1
2.2
0.5
5.5
4.4
487
4.8
3.1
2.5
1.2
0.6
299
195
20
68
570
428
464
15
65
98
10
12
15
8
1
5.4
4.2
4.7
0.6
1.2
1.6
4.3
2.6
3.8
5.3
5.6
0.8
1.1
3.6
3.5
5.1
8.6
7
3
14
11
10
2.7
16.0
6.3
13.9
16.3
16.0
6.5
1.6
11.3
11.5
15.7
12.0
398
161
397
497
528
99
4
13
7
1
14
0.5
347
341
507
400
12
6.
8.
(a) Generate summary statistics, including the mean and
standard deviation of each variable. Compute the
coefficient of variation for each variable. (Use 2 decimal
places.)
Expert Solution
This question has been solved!
Explore an expertly crafted, step-by-step solution for a thorough understanding of key concepts.

This is a popular solution!

Trending now
This is a popular solution!

Step by step
Solved in 2 steps with 5 images

Knowledge Booster


Learn more about
Need a deep-dive on the concept behind this application? Look no further. Learn more about this topic, statistics and related others by exploring similar questions and additional content below.Recommended textbooks for you
Glencoe Algebra 1, Student Edition, 9780079039897…
Algebra
ISBN:
9780079039897
Author:
Carter
Publisher:
McGraw Hill

Holt Mcdougal Larson Pre-algebra: Student Edition…
Algebra
ISBN:
9780547587776
Author:
HOLT MCDOUGAL
Publisher:
HOLT MCDOUGAL

Big Ideas Math A Bridge To Success Algebra 1: Stu…
Algebra
ISBN:
9781680331141
Author:
HOUGHTON MIFFLIN HARCOURT
Publisher:
Houghton Mifflin Harcourt
Glencoe Algebra 1, Student Edition, 9780079039897…
Algebra
ISBN:
9780079039897
Author:
Carter
Publisher:
McGraw Hill
Holt Mcdougal Larson Pre-algebra: Student Edition…
Algebra
ISBN:
9780547587776
Author:
HOLT MCDOUGAL
Publisher:
HOLT MCDOUGAL
Big Ideas Math A Bridge To Success Algebra 1: Stu…
Algebra
ISBN:
9781680331141
Author:
HOUGHTON MIFFLIN HARCOURT
Publisher:
Houghton Mifflin Harcourt