Amanufacturer of mountaineering equipment produces traditional three-strand climbing raope on two separate production ines, Ine 1 and line 2. The manufacturer regularly tests the tensile strength of its ropes by randomly selecting ropes from production and subjecting them to various tests. The results from the most recent random sample of ropes are shown below. Assuming the population of tensile strengths for each line is appraximately normally distributed with equal variances can the manufacturer concude there is a diference between the mean tensile strengths of ropes produced on the two lines? Conduct the appropriate hypothesis test at the 0.05 level of significance Line 2 X 7 223 6.740 S2435 ng 30 n, 25 What are the appropriate hypotheses to test? OB. Hy -20 OC. Hy -s0 HA 0 OF Hy -20 A Hg P20 OD. Hy P20 Datermine the reiection reglon for the test stadisdic Select the corect choice below and flin the ansuer box to complete vour choice (Round to four decimal places as needed) OA Calculate the value of the test statstic tORound to four decimal places as needed) in he rejection region. the nul hypothesis. There is evidence to conclude that the two population means are different Since the test statistic
Amanufacturer of mountaineering equipment produces traditional three-strand climbing raope on two separate production ines, Ine 1 and line 2. The manufacturer regularly tests the tensile strength of its ropes by randomly selecting ropes from production and subjecting them to various tests. The results from the most recent random sample of ropes are shown below. Assuming the population of tensile strengths for each line is appraximately normally distributed with equal variances can the manufacturer concude there is a diference between the mean tensile strengths of ropes produced on the two lines? Conduct the appropriate hypothesis test at the 0.05 level of significance Line 2 X 7 223 6.740 S2435 ng 30 n, 25 What are the appropriate hypotheses to test? OB. Hy -20 OC. Hy -s0 HA 0 OF Hy -20 A Hg P20 OD. Hy P20 Datermine the reiection reglon for the test stadisdic Select the corect choice below and flin the ansuer box to complete vour choice (Round to four decimal places as needed) OA Calculate the value of the test statstic tORound to four decimal places as needed) in he rejection region. the nul hypothesis. There is evidence to conclude that the two population means are different Since the test statistic

Chapter1: Making Economics Decisions
Section: Chapter Questions
Problem 1QTC

Related questions
Question
7
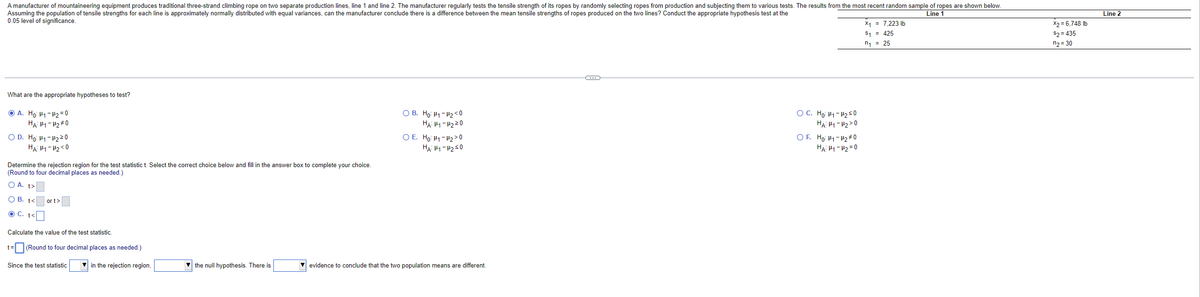
Transcribed Image Text:A manufacturer of mountaineering equipment produces traditional three-strand climbing rope on two separate production lines, line 1 and line 2. The manufacturer regularly tests the tensile strength of its ropes by randomly selecting ropes from production and subjecting them to various tests. The results from the most recent random sample of ropes are shown below.
Assuming the population of tensile strengths for each line is approximately normally distributed with equal variances, can the manufacturer conclude there is a difference between the mean tensile strengths of ropes produced on the two lines? Conduct the appropriate hypothesis test at the
0.05 level of significance.
Line 1
Line 2
X2 = 6,748 lb
$2 = 435
X1 = 7,223 Ib
S, = 425
n, = 25
n2 = 30
What are the appropriate hypotheses to test?
O A. Ho H1-H2= 0
HA H1 - H2#0
O D. Ho H1- 4220
HA: H1- H2 <0
O B. Ho: H1- 42 <0
HẠ H1- 4220
O E. Ho: H1 - 42 > 0
HA: H1- 4250
O C. Ho: H1 - 42s0
HẠ: H1 - H2 >0
O F. Ho: H1- 42# 0
HẠi H1 - H2 = 0
Determine the rejection region for the test statistic t. Select the correct choice below and fill in the answer box to complete your choice.
(Round to four decimal places as needed.)
A. t>
O B. t<
or t>
O C. t<
Calculate the value of the test statistic.
= (Round to four decimal places as needed.)
Since the test statistic
in the rejection region,
V the null hypothesis. There is
V evidence to conclude that the two population means are different.
Expert Solution
This question has been solved!
Explore an expertly crafted, step-by-step solution for a thorough understanding of key concepts.

Step by step
Solved in 4 steps with 4 images

Knowledge Booster


Learn more about
Need a deep-dive on the concept behind this application? Look no further. Learn more about this topic, economics and related others by exploring similar questions and additional content below.Recommended textbooks for you

Principles of Economics (12th Edition)
Economics
ISBN:
9780134078779
Author:
Karl E. Case, Ray C. Fair, Sharon E. Oster
Publisher:
PEARSON

Engineering Economy (17th Edition)
Economics
ISBN:
9780134870069
Author:
William G. Sullivan, Elin M. Wicks, C. Patrick Koelling
Publisher:
PEARSON
Principles of Economics (12th Edition)
Economics
ISBN:
9780134078779
Author:
Karl E. Case, Ray C. Fair, Sharon E. Oster
Publisher:
PEARSON
Engineering Economy (17th Edition)
Economics
ISBN:
9780134870069
Author:
William G. Sullivan, Elin M. Wicks, C. Patrick Koelling
Publisher:
PEARSON

Principles of Economics (MindTap Course List)
Economics
ISBN:
9781305585126
Author:
N. Gregory Mankiw
Publisher:
Cengage Learning

Managerial Economics: A Problem Solving Approach
Economics
ISBN:
9781337106665
Author:
Luke M. Froeb, Brian T. McCann, Michael R. Ward, Mike Shor
Publisher:
Cengage Learning

Managerial Economics & Business Strategy (Mcgraw-…
Economics
ISBN:
9781259290619
Author:
Michael Baye, Jeff Prince
Publisher:
McGraw-Hill Education